META 20-day bearish forecast — Nov 8, 2026
- Bias: Bearish
- Timeframe: 20 days (made Nov 8, 2026, target date Nov 27, 2026)
- Price at analysis: $610.15
- Price target: $594.00
- Expected range: $548.00 – $650.00
- Result: Pending — graded after the close on Nov 27, 2026
Get a free AI analysis of META today
Analysis
TECHNICAL INDICATORS
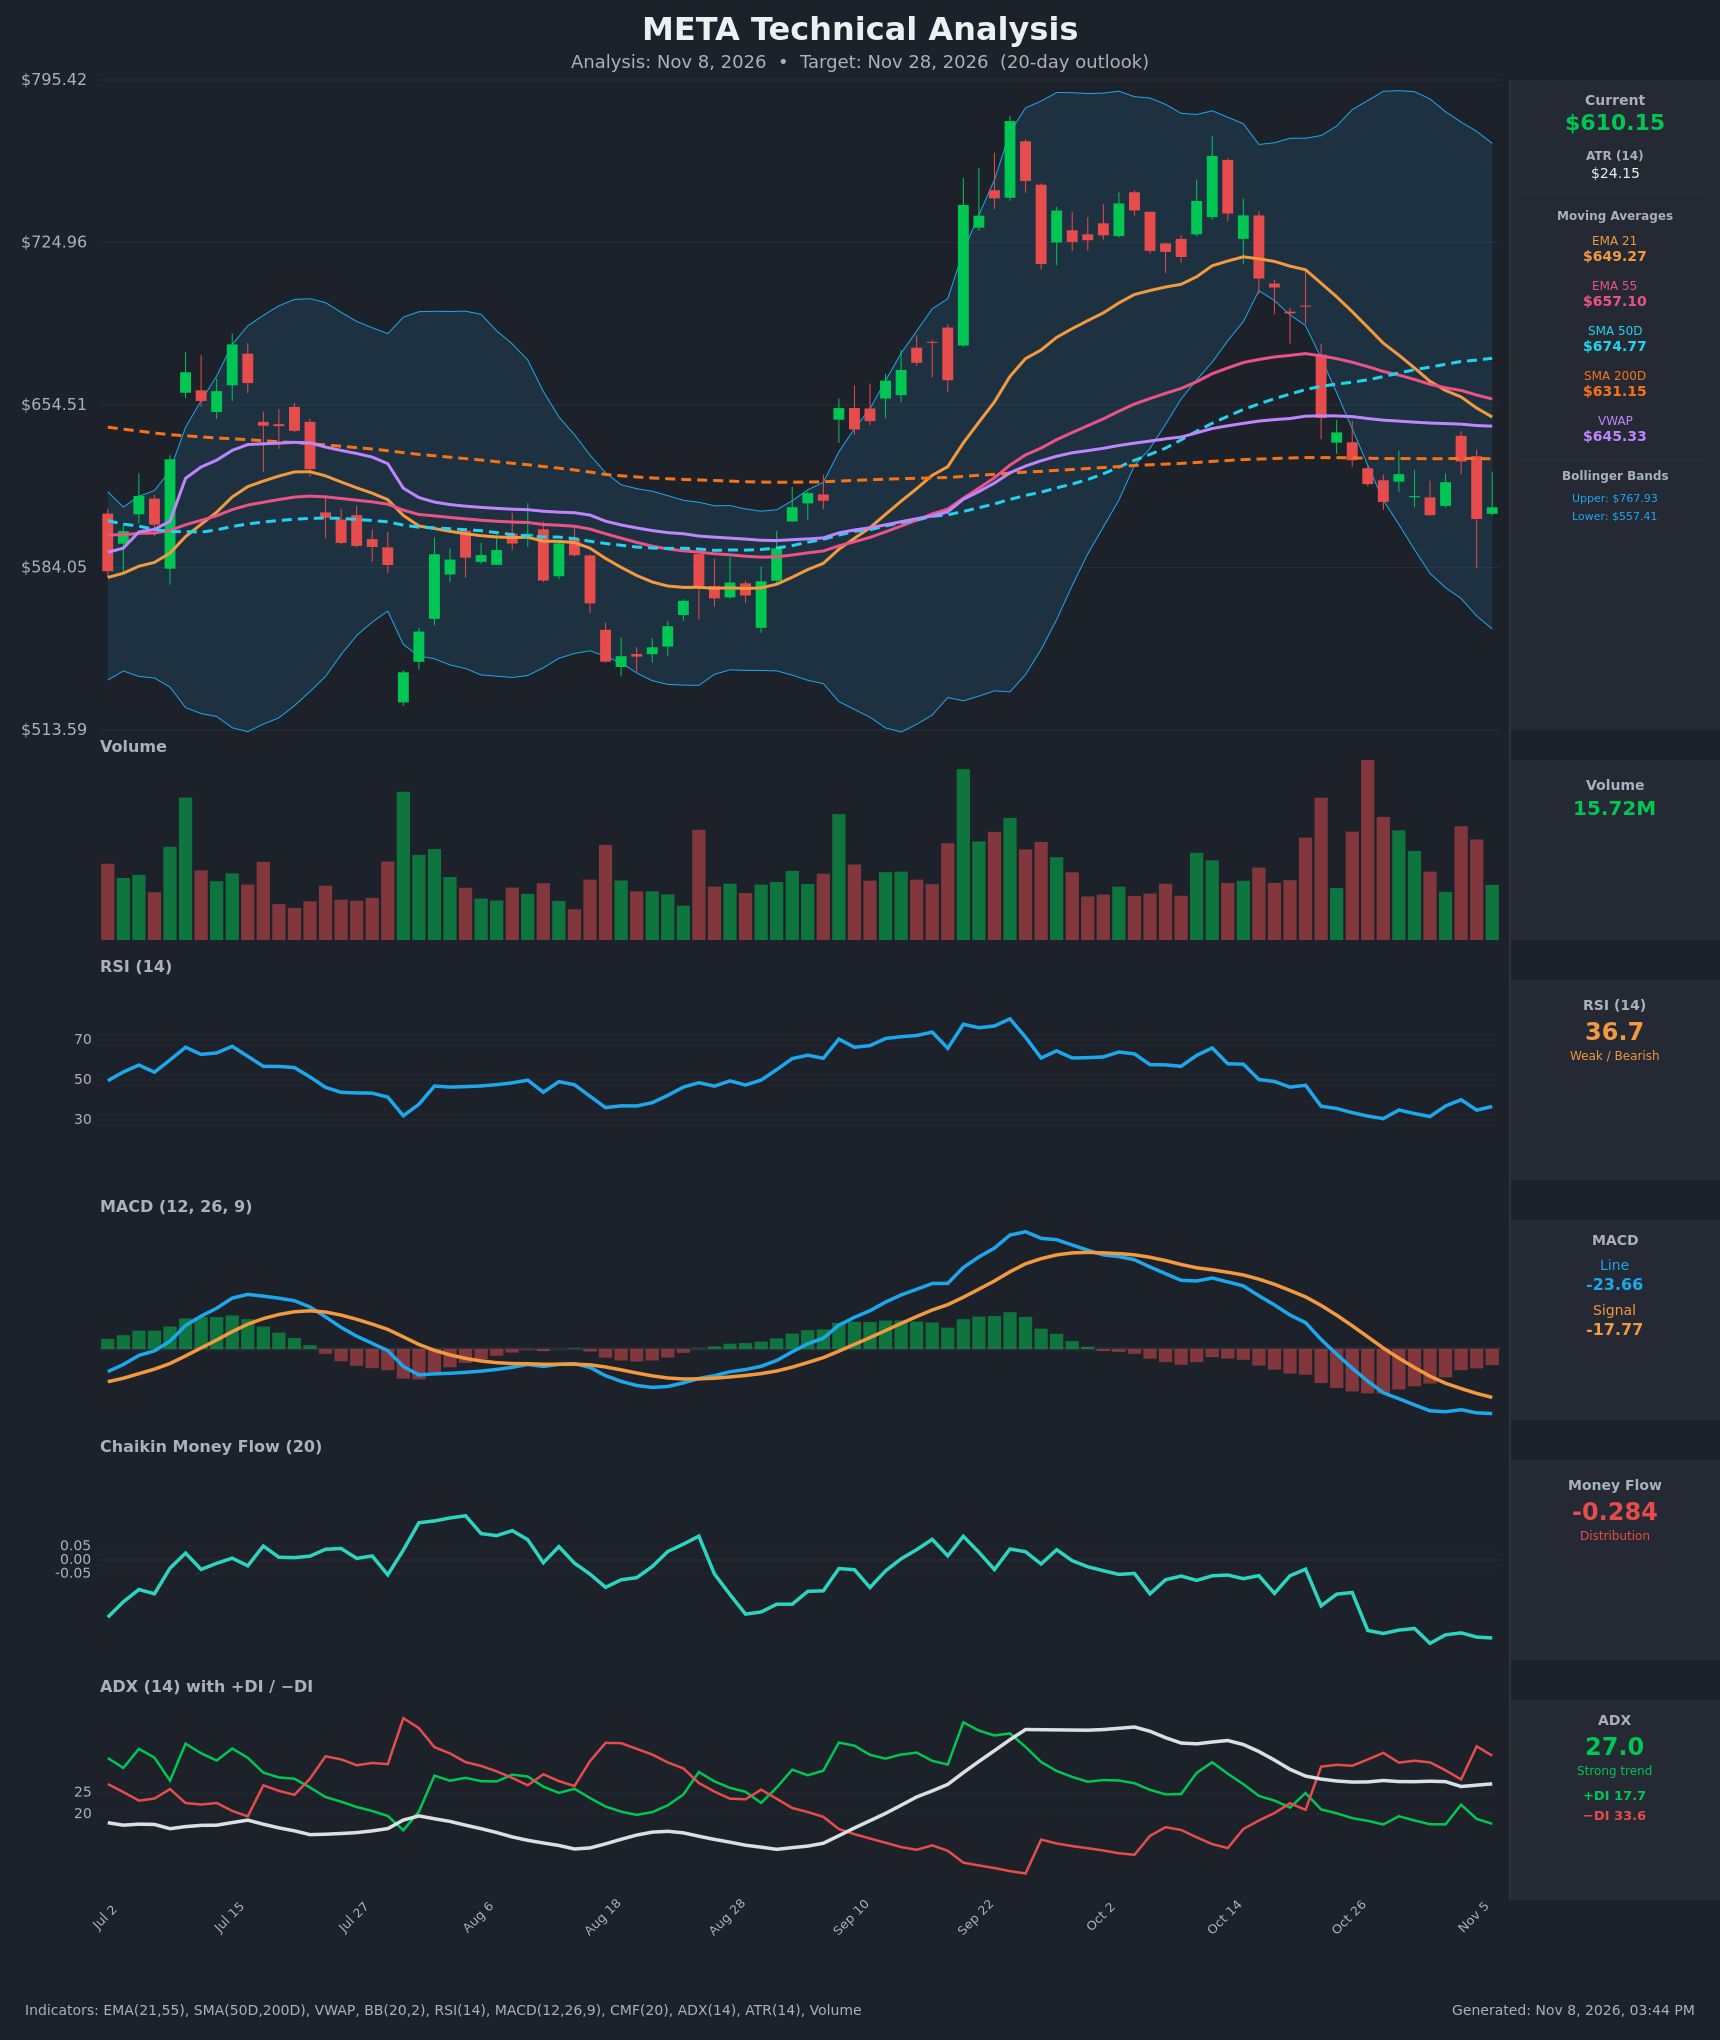
- RSI (14): 36.74, near oversold but still above 30. It has been below 50 since mid-October and bottomed at 30.7 on Oct 28. Recent bounces to 40 failed, so momentum remains weak. [Bearish]
- 20 EMA: The nearest tracked value is the EMA 21 at $649.27, with price at $610.15 about 6% below it. The EMA has been falling steadily and now sits below the EMA 55 ($657.10), so it acts as overhead resistance. [Bearish]
- MACD: Line at -23.66, signal at -17.77, histogram negative at about -5.9. The bearish crossover was on Oct 23 and the line is still making new lows, so the gap is widening. [Bearish]
- Bollinger Bands (20): Upper $767.93, lower $557.41, midline about $662.67. The bands are wide after the September–October volatility. Price is in the lower half, roughly 25% of the band width above the lower band, and has not tagged it. The pattern is walking down from the midline. [Bearish]
- CMF (20): -0.284, well below -0.05 and near the lowest of the visible period. It has been persistently negative since mid-October, which means heavy distribution. [Distribution]
- ADX (14): 27.0 with −DI (33.6) well above +DI (17.7). ADX is above 25 and holding steady, so this is an established downtrend with bears in control. [Strong Trend – Bearish]
- Volume: 15.72M on the last bar. Volume spiked on the red candles from the Oct 22 gap-down and again on Nov 5. Bounce days have had lighter volume. The latest green candle was small and on lower volume, so it is not a reversal signal. [Bearish – selling pressure dominates]
DIVERGENCES & TRENDS
- No bullish RSI divergence yet. RSI's Oct 28 low of 30.7 came with a price low of $612.49. The Nov 2 price low of $606.73 came with RSI at 31.7, a marginally higher RSI low. This is a very mild, unconfirmed positive divergence, and the Nov 5 low of $605.08 had RSI at 35.0.
- MACD is making new lows (-23.66 vs the prior -22.99 on Nov 3), confirming the price weakness.
- A death-cross-style setup is forming: EMA21 ($649.27) crossed below EMA55 ($657.10) on Nov 4. SMA50D ($674.77) is still above SMA200D ($631.15), so there is no formal death cross yet, but the gap is narrowing in price terms as price sits below both.
- Price is below the EMA21, EMA55, SMA50D, VWAP ($645.33) and SMA200D ($631.15). The SMA200D is the key long-term support that has been broken.
- Lower highs have formed since the October peak at about $760.
- The SMA200D around $631 has flipped from support to resistance.
CHART PATTERNS
- Bearish continuation / descending channel: Since the October peak, price has made lower highs and lower lows, resembling a Bearish Flag/Pennant at the $605–$630 range. A break below the roughly $605 base would project further downside.
- Possible Bullish Falling Wedge or Double Bottom: The lows at $606.73 and $605.08 (Nov 2 and Nov 5) form a potential Double Bottom with neckline resistance near $630, around the SMA200D. A close above $630 would be the first reversal signal, but it is not confirmed.
- Targets: Bearish flag measured move is around $560–$575, near the lower Bollinger Band and the early-August congestion area. The double-bottom target is around $655, the neckline plus the pattern height.
POTENTIAL SCENARIOS
- Scenario 1: Bearish Breakdown Below the $605 Double-Bottom Support — Sellers keep control with −DI dominant, CMF deeply negative and MACD still falling. Price breaks the $605 support and tests the lower Bollinger Band. Trigger: daily close below $605. Target: $565–$575. Invalidation: daily close above $632 (the SMA200D). (50% probability)
- Scenario 2: Bullish Double-Bottom Relief Bounce — RSI is near oversold and price has held $605 twice, so a mean-reversion bounce is plausible. It would stall at the falling EMA21/EMA55 and VWAP. Trigger: close above $630 on rising volume. Target: $650–$657. Invalidation: close below $600. (30% probability)
- Scenario 3: Neutral Range Chop — Price consolidates between $595 and $635 as momentum stabilizes. Trigger: failure to break either $605 or $630. Target: $605–$630 range. Invalidation: a close outside $590–$640. (20% probability)
PRICE TARGETS
- Target Price: $594.00 (20-day, a modest decline toward the lower Bollinger Band area)
- Expected Range: $548.00 to $650.00 (width $102 ≈ 16.7% of current price, consistent with the ~12–18% guidance for 30–60 days and the 20-day ATR-based move of roughly ±$24 × √20 ≈ ±$108 at the extremes)
- Key Levels: Support at $605.00, Resistance at $631.15
OVERALL BIAS
OVERALL BIAS: BEARISH - Price is below every major moving average, including the SMA200D. MACD is bearish and widening, CMF shows heavy distribution (-0.284), and ADX at 27 with −DI far above +DI confirms a strong downtrend. The oversold-ish RSI and the potential double bottom at $605 argue for a bounce risk, but the trend evidence outweighs it.
This is educational analysis and not financial advice.