INTC 20-day bearish forecast — Nov 8, 2026
- Bias: Bearish
- Timeframe: 20 days (made Nov 8, 2026, target date Nov 27, 2026)
- Price at analysis: $56.28
- Price target: $53.50
- Expected range: $50.50 – $57.50
- Result: Pending — graded after the close on Nov 27, 2026
Get a free AI analysis of INTC today
Analysis
TECHNICAL INDICATORS
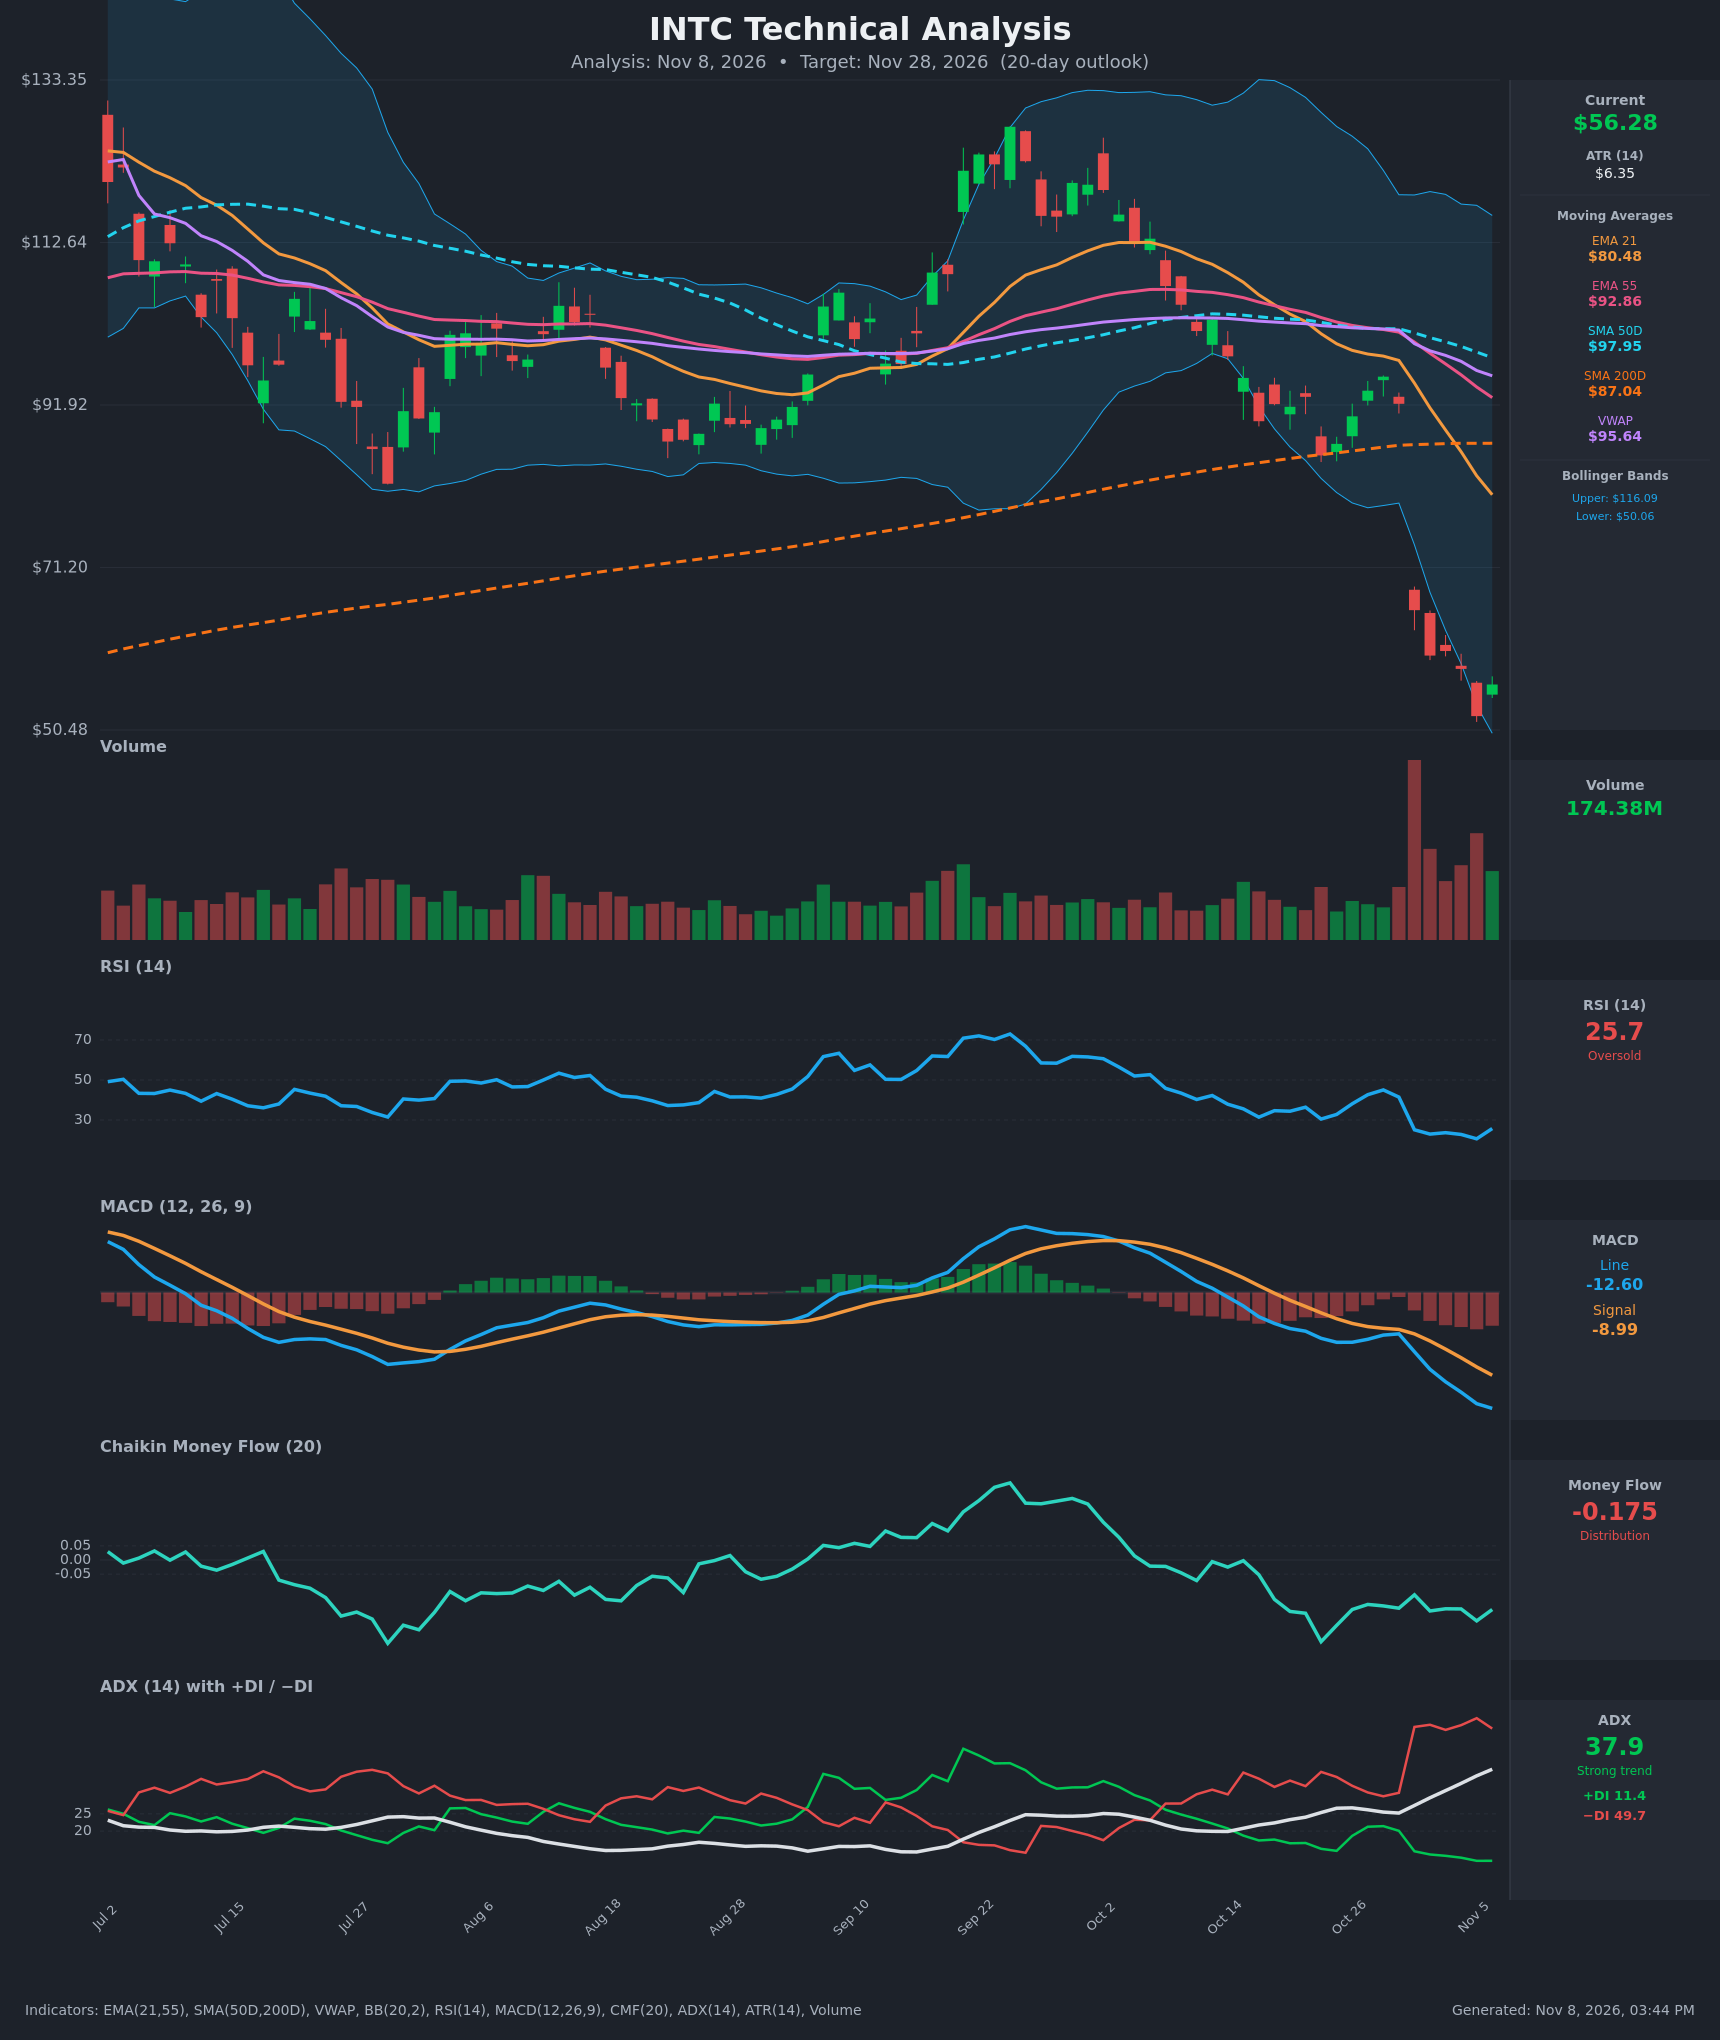
- RSI (14): 25.72, oversold. It bottomed at 20.6 on Nov 5 and ticked up to 25.7 with the latest bounce, but it is still below 30 and has not shown a bullish divergence. Oversold readings in a strong downtrend often persist. [Neutral]
- 20 EMA: The 21 EMA is $80.48, about 43% above price, and falling steeply. Price is well below it, so it acts as distant resistance. The 21 EMA crossed below the 55 EMA ($92.86) around Oct 19-20, and the gap keeps widening. [Bearish]
- MACD: The line is -12.60 against a signal of -8.99, a bearish crossover that is widening. The histogram is deeply negative at about -3.6 and still expanding. There is no sign of momentum turning. [Bearish]
- Bollinger Bands (20): Upper $116.09, lower $50.06, so the bands are extremely wide after the volatility shock. Price at $56.28 sits in the lower fifth of the band. The Oct 30 gap took price through the lower band, and the last close of $52.25 came very close to it. This is stretched, but "walking the band" in a trend is common. [Neutral]
- CMF (20): -0.175, well below -0.05. It has been negative for months and the Oct 30 breakdown pushed it lower again. This is persistent distribution. [Distribution]
- ADX (14): 37.9 and rising from 22 in mid-October, which is a strong trend. −DI at 49.7 is far above +DI at 11.4, so bears are firmly in control. [Strong Trend – Bearish]
- Volume: 174.38M on the latest bar. Volume spiked massively on the Oct 30 breakdown (the largest bar on the chart) and stayed elevated for the following sessions, which suggests capitulation and repricing. The Nov 6 bounce came on lighter volume than the selloff days, so it is not a convincing reversal. [Bearish – heavy distribution, weak bounce]
DIVERGENCES & TRENDS
- There is no bullish RSI or MACD divergence. Price made new lows on Nov 5 and RSI made new lows with it (20.6), so momentum confirmed the lows.
- The MACD line is still falling away from the signal line with an expanding negative histogram, so there is no early turn yet.
- Price is below the 21 EMA, 55 EMA, SMA50D ($97.95), VWAP ($95.64), and now also the SMA200D ($87.04). The 200D is rolling over, and the SMA50D is falling toward it. A death cross is approaching but has not yet happened, with a gap of about $11.
- ADX has risen steadily from the low 20s to 38, and the −DI jump from about 31 to about 50 on Oct 30 marks a regime change to a strong downtrend.
- CMF shows lower lows, which means sustained selling pressure. There is no accumulation signal.
- The Nov 6 bounce (+7.7%) is the first positive close in a week. It is so far only a relief bounce below all resistance levels.
CHART PATTERNS
- The September peak near $125 followed by the October lower high near $120 resembles a Bearish Double Top. The neckline near $92-100 broke in late October, and the Oct 30 gap down accelerated the breakdown. The measured move from the pattern points well below $90, so that target has already been met and exceeded.
- The recent action is a vertical gap-and-drop with small-bodied candles near the lows. This is a continuation of the downtrend rather than a classic reversal.
- A small base of consolidation near $52-60 could develop into a Bullish Falling Wedge or Double Bottom if $52.25 holds on a retest. That is not confirmed. Any bounce into $60-65 would be a lower high under falling resistance.
POTENTIAL SCENARIOS
- Scenario 1: Bearish Downtrend Resumption — The Nov 6 bounce fades into resistance at the $60 gap-fill zone. Sellers regain control, and price retests and probes the lower Bollinger Band. Trigger: rejection at $58-60 followed by a close below $52.25 on rising volume. Target: $50.00-$53.50. Invalidation: daily close above $62. (50% probability)
- Scenario 2: Bullish Oversold Relief Rally — RSI is deeply oversold and price is far from the 21 EMA, so mean reversion pulls price higher. Trigger: close above $60.55 with MACD histogram contraction. Target: $62-$66 (about 1 ATR above the gap area, with a limited run toward the declining 21 EMA). Invalidation: close below $52.25. (35% probability)
- Scenario 3: Neutral Base Building — Price stabilizes after capitulation and chops between support and resistance. Trigger: ADX rolls over and volume contracts. Target: $53-$59. Invalidation: close outside $50.00-$60.55. (15% probability)
PRICE TARGETS
Self-check: the Expected Range is $50.50 to $57.50, a width of $7.00, or 12.4% of the $56.28 current price. That sits at the top of the 8-12% guidance for 14-21 days. I kept it at the upper end because ATR is elevated at $6.35.
- Target Price: $53.50 (20 trading days, Nov 28, 2026)
- Expected Range: $50.50 to $57.50
- Key Levels: Support at $52.25 (Nov 5 closing low, with the lower Bollinger Band at $50.06 just below), Resistance at $60.55 (Nov 3 closing level and gap zone)
OVERALL BIAS
OVERALL BIAS: BEARISH - The stock is in a strong downtrend: ADX 37.9 with −DI at 49.7 against +DI at 11.4, a MACD bearish crossover with an expanding negative histogram, CMF distribution at -0.175, and price below every major moving average. RSI is oversold, so bounces are likely and the downside may be limited, but the evidence favors a retest of the $50-$53 area over a sustained recovery.
This is educational analysis and not financial advice.