MU 20-day bearish forecast — Nov 8, 2026
- Bias: Bearish
- Timeframe: 20 days (made Nov 8, 2026, target date Nov 27, 2026)
- Price at analysis: $690.00
- Price target: $655.00
- Expected range: $620.00 – $705.00
- Result: Pending — graded after the close on Nov 27, 2026
Get a free AI analysis of MU today
Analysis
TECHNICAL INDICATORS
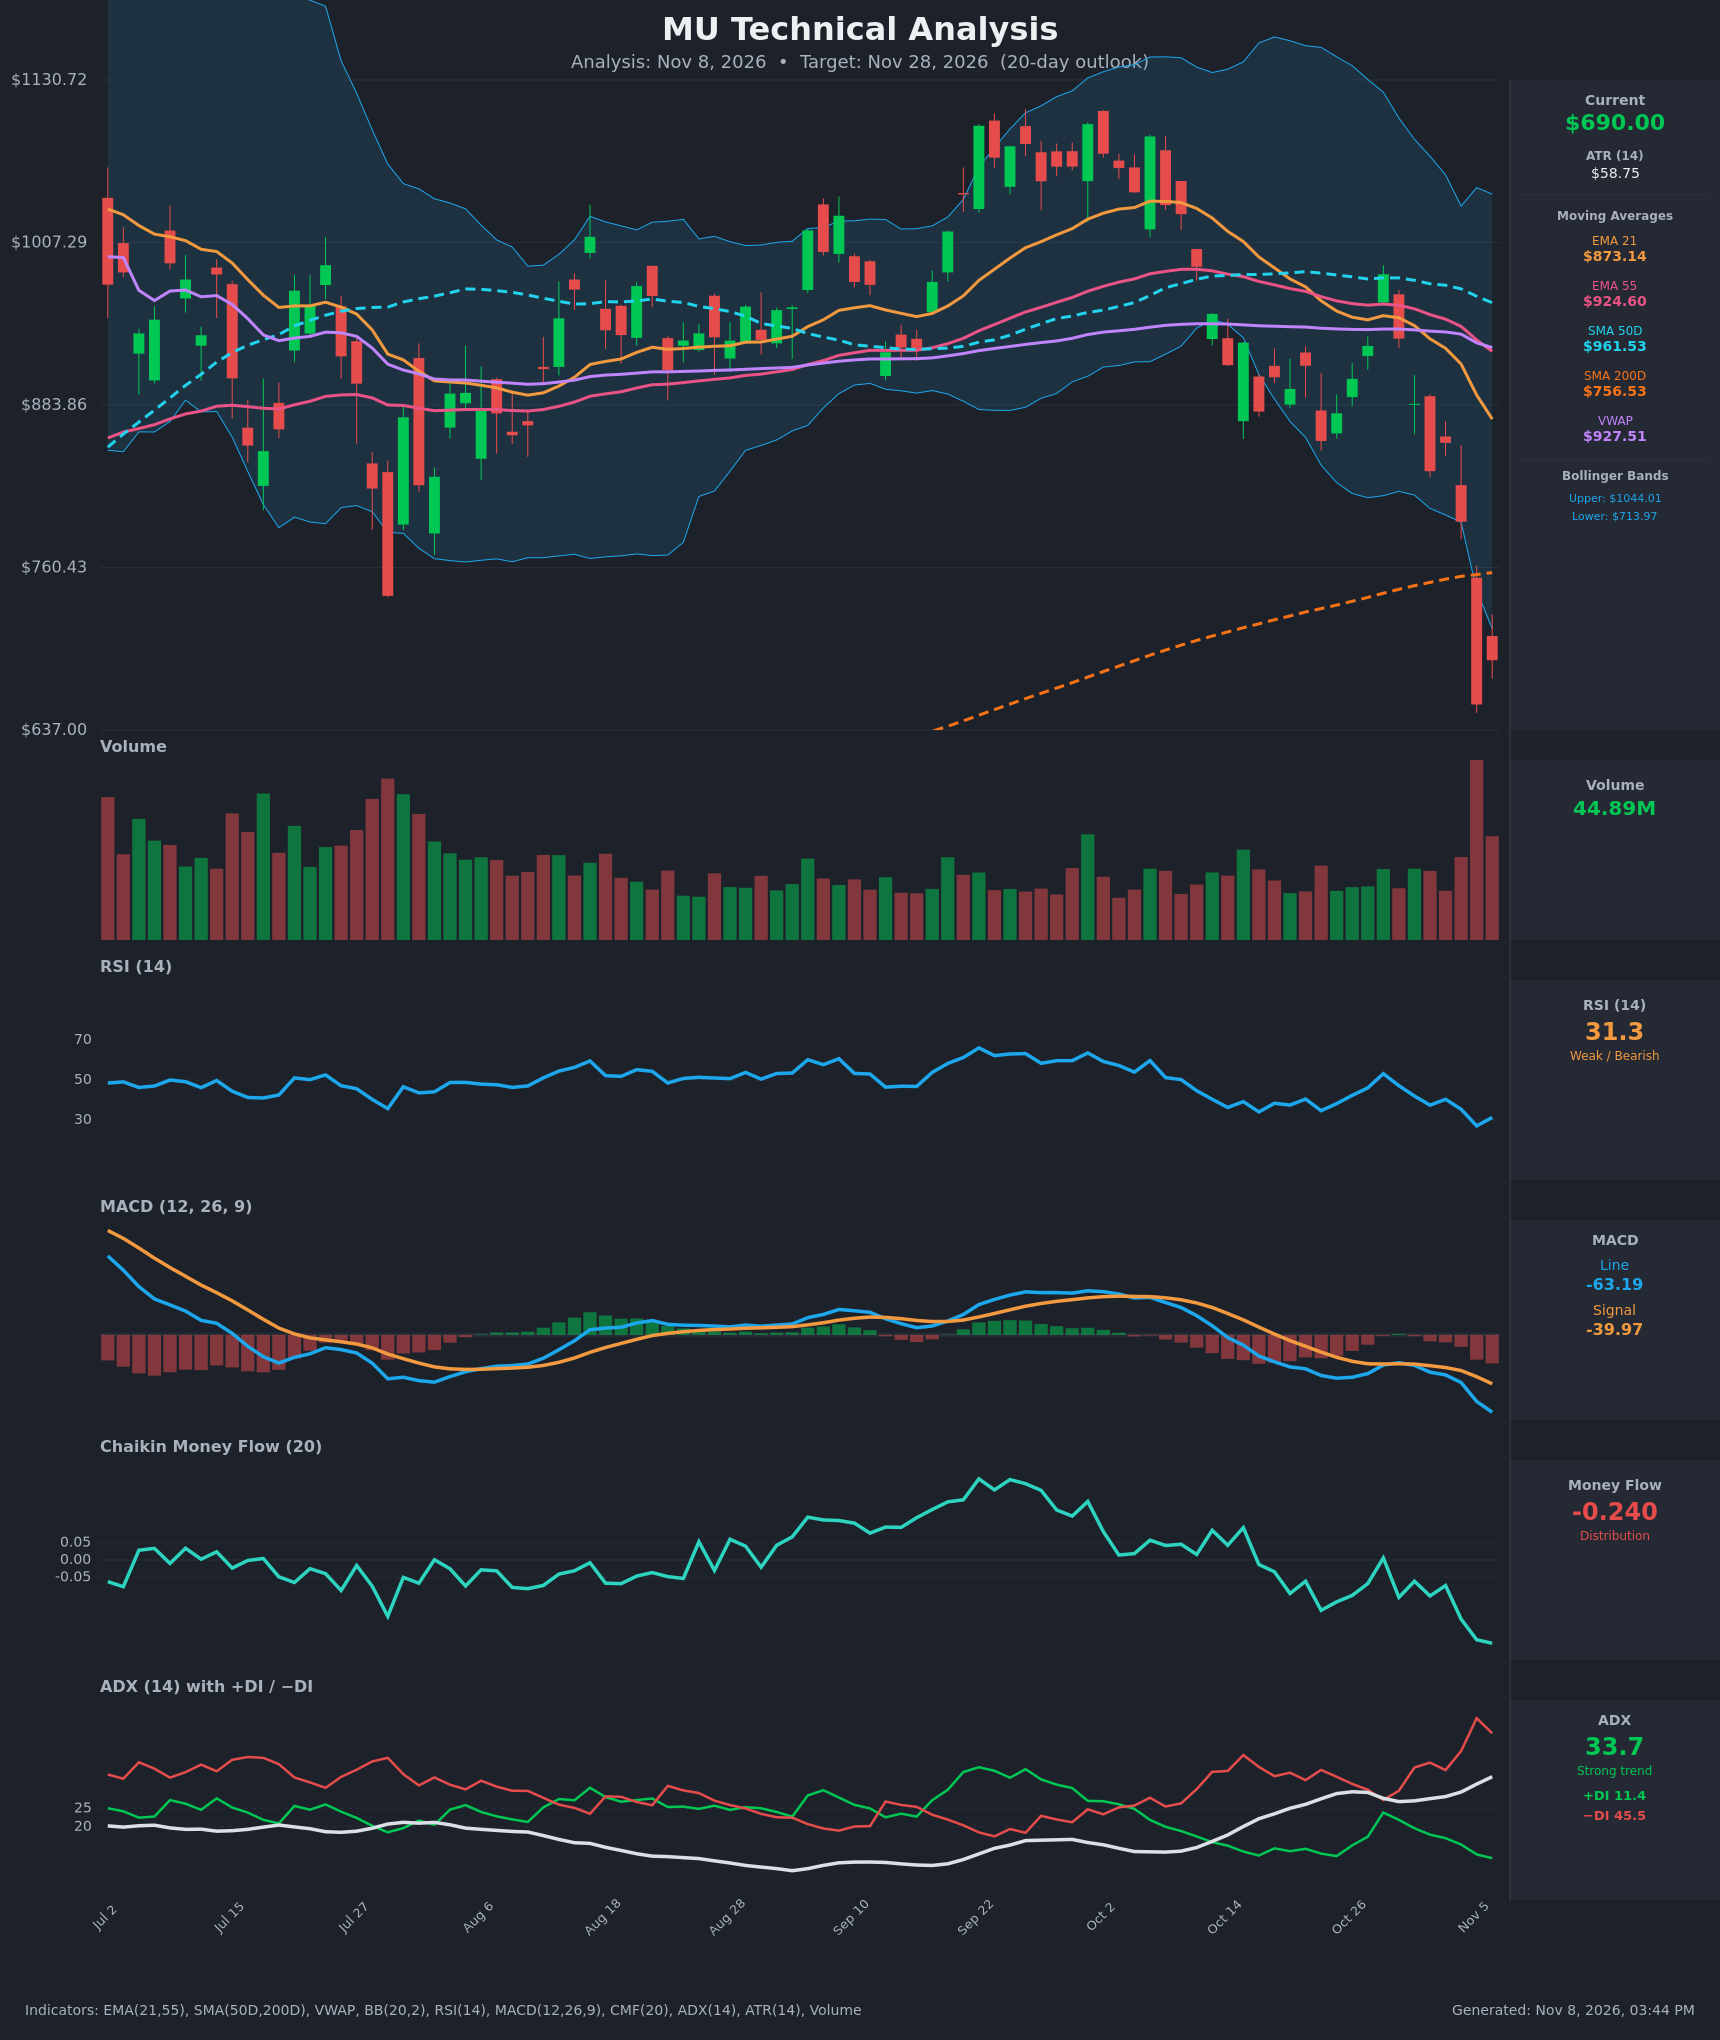
- RSI (14): 31.27, just above the 30 oversold line. It fell from 53 on Oct 28 and hit 27.1 on Nov 5 before a small bounce. Momentum is still pointing down, and oversold readings in a strong downtrend often stay oversold. [Bearish]
- 20 EMA: The EMA 21 is $873.14 and price at $690 is about 21% below it. The EMA 21 is also below the EMA 55 ($924.60) after a bearish cross around Oct 22. Both averages are falling and act as overhead resistance. [Bearish]
- MACD: The line is -63.19 against a signal of -39.97, so the histogram is about -23.2 and widening. The line has been below the signal since mid-October and is making new lows. There is no sign of a bullish cross yet. [Bearish]
- Bollinger Bands (20): Price is $690 against a lower band of $713.97, so it is trading outside the lower band (the Nov 5 low of $656 was far outside). The bands have expanded sharply, which signals a volatility breakout to the downside. A band-walk like this is a trend signal. It also means a mean-reversion bounce is possible. [Bearish]
- CMF (20): -0.240, deep in distribution and falling steadily from +0.0 on Oct 28. Sustained selling pressure is confirming the price drop. [Distribution]
- ADX (14): 33.7 and rising (from 23.6 on Oct 19). −DI is 45.5 and +DI is 11.4, so the bears are firmly in control. This is a strong, accelerating downtrend. [Strong Trend - Bearish]
- Volume: 44.89M on the latest bar, well below the huge spike on the Nov 5 breakdown candle. The heavy-volume capitulation-style drop confirms sellers are dominant. The lighter follow-through volume hints at some stabilization but is not a reversal signal. [Bearish with early exhaustion signs]
DIVERGENCES & TRENDS
- Divergences: There is no bullish divergence. RSI (27.1 → 31.3) and MACD both made new lows alongside price, so momentum is confirming the decline.
- Trend in the indicators:
- ADX is rising, −DI spiked from 30 to 49.7, and CMF is trending lower.
- Price is below the EMA 21, EMA 55, SMA 50D, VWAP ($927.51) and now the SMA 200D ($756.53).
- The SMA 200D (flat-to-rising) was lost on Nov 5, which is a significant long-term break.
- Crossovers and breaks:
- The EMA 21 crossed below the EMA 55, which is bearish.
- The SMA 50D is still above the SMA 200D, but the gap is narrowing quickly toward a possible death cross.
- Price lost the Aug-Oct consolidation floor near $830-$850 on a gap-style drop and closed outside the lower Bollinger Band.
- Oversold caveat: Price is about 21% below its EMA 21 and outside the lower band with RSI near 30. A relief bounce toward $714-$756 is plausible, but it would likely face resistance.
CHART PATTERNS
- Bearish Double Top (with breakdown): Price peaked near $1,080-$1,090 in late Sep and early Oct, then rolled over. The neckline near $850 gave way in early November. The measured move is about $230 ($1,085 - $850), pointing to roughly $620.
- Bearish Head and Shoulders / Expanding Triangle character: The wide, volatile Jul-Oct range with lower highs after the peak resembles a distribution structure that has now resolved downward.
- Significance: The breakdown comes on heavy volume with a strong ADX, which favors continuation. The measured target of about $620 is consistent with the lower end of the expected range.
POTENTIAL SCENARIOS
- Scenario 1: Bearish Trend Continuation — Sellers stay in control. A weak bounce fails below the lower Bollinger Band and the EMA 21 resistance. Price then makes new lows toward the measured-move area. Trigger: a close below $656.39 (the Nov 5 low). Target: $620-$640, with an extension toward $600. Invalidation: a daily close above $756 (SMA 200D). (50% probability)
- Scenario 2: Bullish Oversold Relief Bounce — A capitulation-style flush, RSI near 30 and a price far from its means trigger a snap-back rally. Price retests the broken $714 band and the SMA 200D area. Trigger: a close above $714 on rising volume with the RSI above 40. Target: $756-$790. Invalidation: a close back below $656. (33% probability)
- Scenario 3: Neutral Basing Range — Price stabilizes after the shock and chops between support and resistance as indicators reset. Trigger: several sessions of narrow ranges holding $656. Target: $660-$715. Invalidation: a break of either boundary. (17% probability)
PRICE TARGETS
- Target Price: $655.00 (20-day horizon)
- Expected Range: $620.00 to $705.00 (width of $85, about 12.3% of current price, consistent with a 14-21 day horizon)
- Key Levels: Support at $656.39, Resistance at $713.97
OVERALL BIAS
OVERALL BIAS: BEARISH - Price is below every key moving average and the VWAP, with a rising ADX of 33.7 and −DI at 45.5, a deeply negative CMF and a widening bearish MACD. The breakdown from a double-top structure points to a measured move near $620. An oversold relief bounce is a real risk, but a bounce into $714-$756 would likely meet resistance.
This is educational analysis and not financial advice.