ASTS 27-day bearish forecast — Nov 8, 2026
- Bias: Bearish
- Timeframe: 27 days (made Nov 8, 2026, target date Dec 4, 2026)
- Price at analysis: $32.33
- Price target: $29.50
- Expected range: $27.00 – $33.00
- Result: Pending — graded after the close on Dec 4, 2026
Get a free AI analysis of ASTS today
Analysis
TECHNICAL INDICATORS
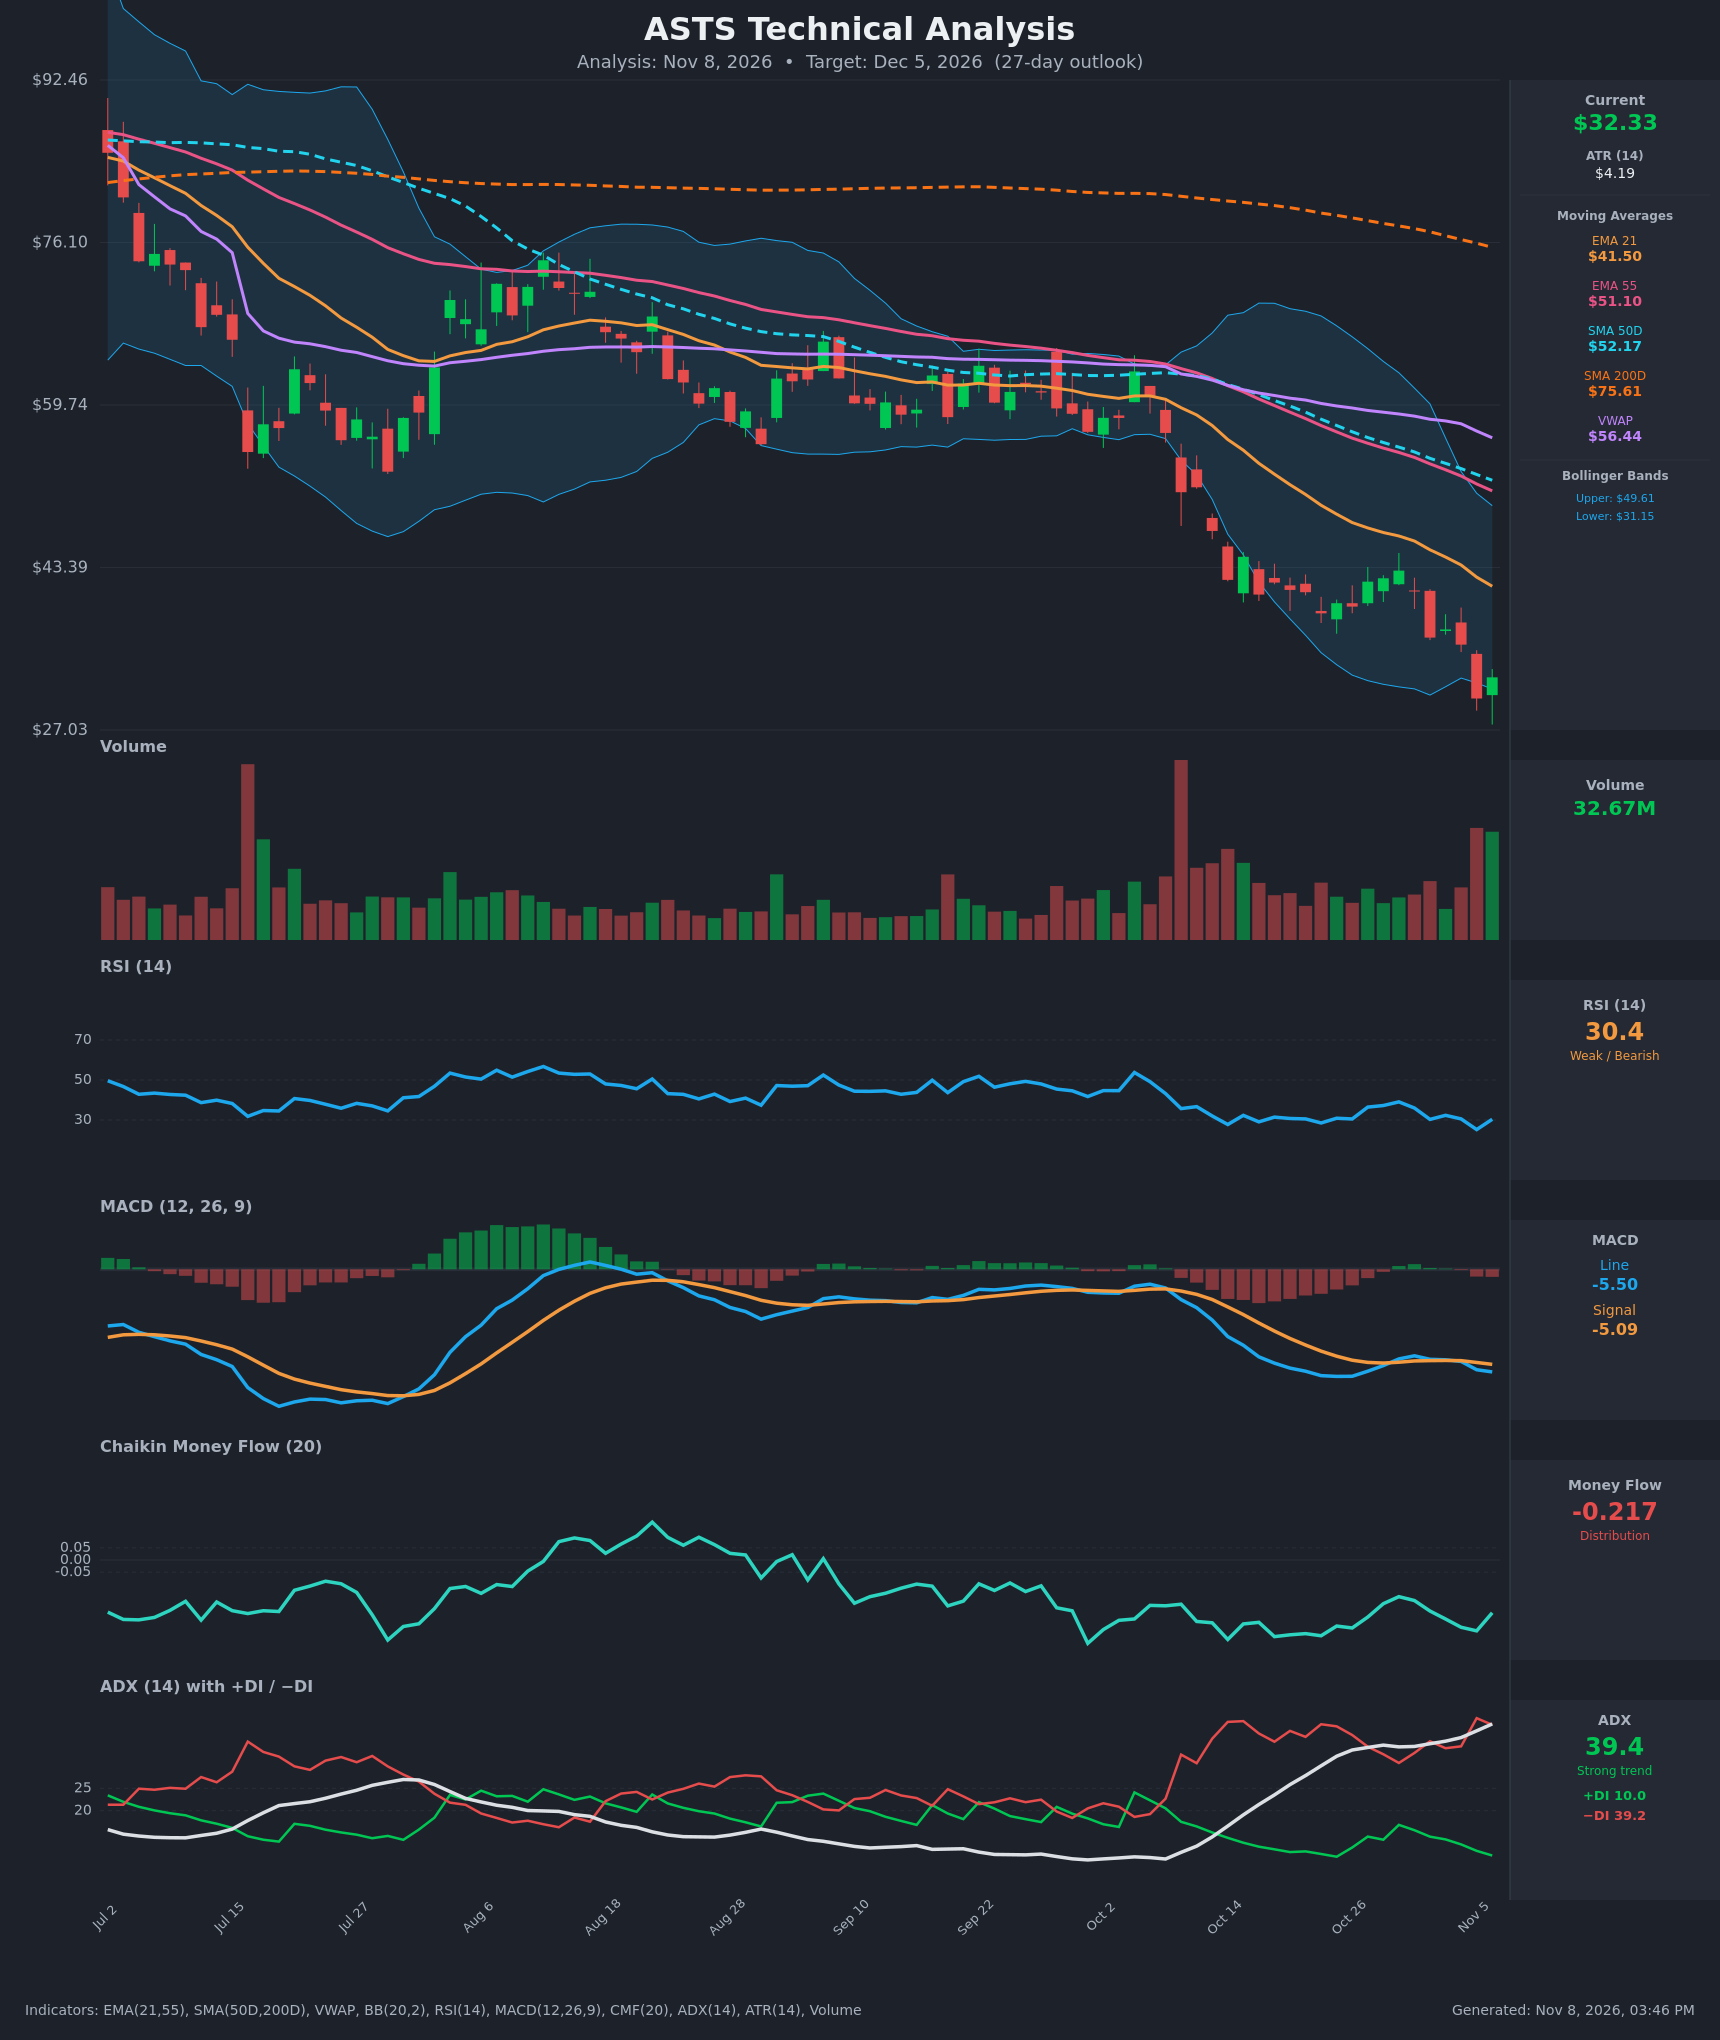
- RSI (14): 30.36, right at the oversold threshold. It dipped to 25.2 on Nov 5 and bounced to 30.4. It has made lower highs and lower lows since early October, so momentum is still down. The bounce from oversold is a modest positive. [Bearish]
- 20 EMA: The chart uses the EMA 21 at $41.50, and price at $32.33 is about 22% below it. The EMA 21 is also below the EMA 55 ($51.10), and the gap is widening. The 21 EMA is now overhead resistance. [Bearish]
- MACD: The line is -5.495 and the signal is -5.090. The line crossed back below the signal around Nov 4, and the histogram is turning negative again after a brief flattening. Both lines are well below zero. [Bearish]
- Bollinger Bands (20): The upper band is $49.61 and the lower is $31.15. Price is hugging the lower band after a sharp expansion. The last candle printed a long lower wick, which is a sign of a possible short-term bounce. The bands are wide, which means high volatility and a trending move. [Bearish]
- CMF (20): -0.217, well beyond the -0.05 distribution threshold. It has stayed negative (-0.15 to -0.31) through the whole October-November decline. It improved slightly versus Nov 5 (-0.292), but selling pressure still dominates. [Distribution]
- ADX (14): 39.4 and rising, with -DI at 39.2 and +DI at 10.0. This is a strong, established downtrend with sellers clearly in control. An ADX this high can also precede a relief bounce or exhaustion. [Strong Trend – Bearish]
- Volume: 32.67M on the latest bar, among the highest in the window. The bar was green, after a heavy red capitulation-style bar on Nov 5. Heavy volume near a low can mark selling climax, but one bounce bar has not confirmed a reversal. The only comparable spike was the Oct 14 breakdown bar, which led to more downside. [Elevated – Possible Capitulation, Unconfirmed]
DIVERGENCES & TRENDS
- No bullish divergence is confirmed. Price made a new low at $30.20 (Nov 5), and RSI also made a new low at 25.2. The RSI lows are close to those from late October (about 28.5), so momentum is confirming the price lows rather than diverging.
- MA structure: Price sits below the EMA 21, EMA 55, SMA 50D ($52.17), SMA 200D ($75.61) and VWAP ($56.44). The SMA 50D is far below the SMA 200D (a long-standing death cross). Every moving average is sloping down.
- MACD: A bearish re-cross occurred around Nov 4. The line is below the signal, with a negative histogram and no positive momentum shift yet.
- ADX/DI: ADX has risen from 23.5 to 39.4 in 15 bars while -DI has stayed far above +DI (+DI is just 10). The trend is accelerating.
- CMF: It has been negative all of October and November with no accumulation. The small uptick is not enough to signal a change.
- Price action: Lower highs and lower lows. After the Oct 14 breakdown, price consolidated at $38–$43 and then broke down again. The latest bar is a hammer-like candle with a lower wick down to about $27, suggesting possible short-term exhaustion.
CHART PATTERNS
- Bearish Flag/Pennant continuation (primary): After the sharp drop from about $58 to $40 in early October, price consolidated sideways in a narrow band at $38–$43 and then broke down. This matches the Bearish Flag/Pennant continuation pattern in the reference. The measured move from the pole points toward the high $20s, and price has already reached the low $30s.
- Larger structure: Since July the stock has made a series of lower highs below declining EMAs, which is a persistent downtrend. It is not a classic head-and-shoulders or double-top completion.
- Possible Bullish Falling Wedge (secondary and unconfirmed): Decelerating lower lows with an oversold RSI and a lower-wick bar can set up a falling-wedge style reversal. It needs a close above about $36–$37 to start to be credible. Without that, the bearish flag target stays dominant.
POTENTIAL SCENARIOS
- Scenario 1: Bearish Trend Continuation — The strong downtrend (ADX near 40, -DI dominant, CMF in distribution) persists, with rallies sold at the falling EMA 21 area and price grinding toward or below the recent $27 low. Trigger: failure to reclaim $35.60 and a close below $30.20. Target: $27.00–$29.00, with a possible overshoot to the mid-$20s. Invalidation: daily close above $38.00 (above the Nov 4 area and the Oct 30 gap zone). (50% probability)
- Scenario 2: Bullish Relief Bounce — Oversold RSI, the lower Bollinger Band test and the high-volume hammer-like bar lead to a technical rebound toward the breakdown area, followed by a lower high. Trigger: close above $35.62 and then $37.15 with CMF rising toward -0.05. Target: $37.00–$41.50 (the EMA 21 area acts as resistance). Invalidation: close below $30.20. (35% probability)
- Scenario 3: Neutral Base Building — Price chops between roughly $29 and $35 while volatility contracts. Trigger: holding above $30.20 without closing above $35.60. Target: $30.00–$34.00. Invalidation: a daily close outside that range. (15% probability)
PRICE TARGETS
- Target Price: $29.50 (27 days, Dec 5, 2026)
- Expected Range: $27.00 to $33.00. The width is $6.00, about 18.6% of the current price. That is at the upper end of the 30–60 day guidance and is consistent with the elevated ATR of $4.19 (13% of price). Realistically, risk skews to wider swings in both directions.
- Key Levels: Support at $27.03 (recent swing low and chart floor), Resistance at $35.62 (Nov 4 close and breakdown area, ahead of the EMA 21 near $41.50)
OVERALL BIAS
OVERALL BIAS: BEARISH - Price is below every moving average, MACD has re-crossed bearish, ADX near 40 with -DI far above +DI shows a dominant downtrend, and CMF at -0.217 shows persistent distribution. The oversold RSI and the high-volume hammer bar make a relief bounce a real risk, but it has not been confirmed, so continuation toward the high-$20s remains the more likely path.
This is educational analysis and not financial advice.