META 27-day bearish forecast — Nov 8, 2026
- Bias: Bearish
- Timeframe: 27 days (made Nov 8, 2026, target date Dec 4, 2026)
- Price at analysis: $610.15
- Price target: $588.00
- Expected range: $548.00 – $641.00
- Result: Pending — graded after the close on Dec 4, 2026
Get a free AI analysis of META today
Analysis
TECHNICAL INDICATORS
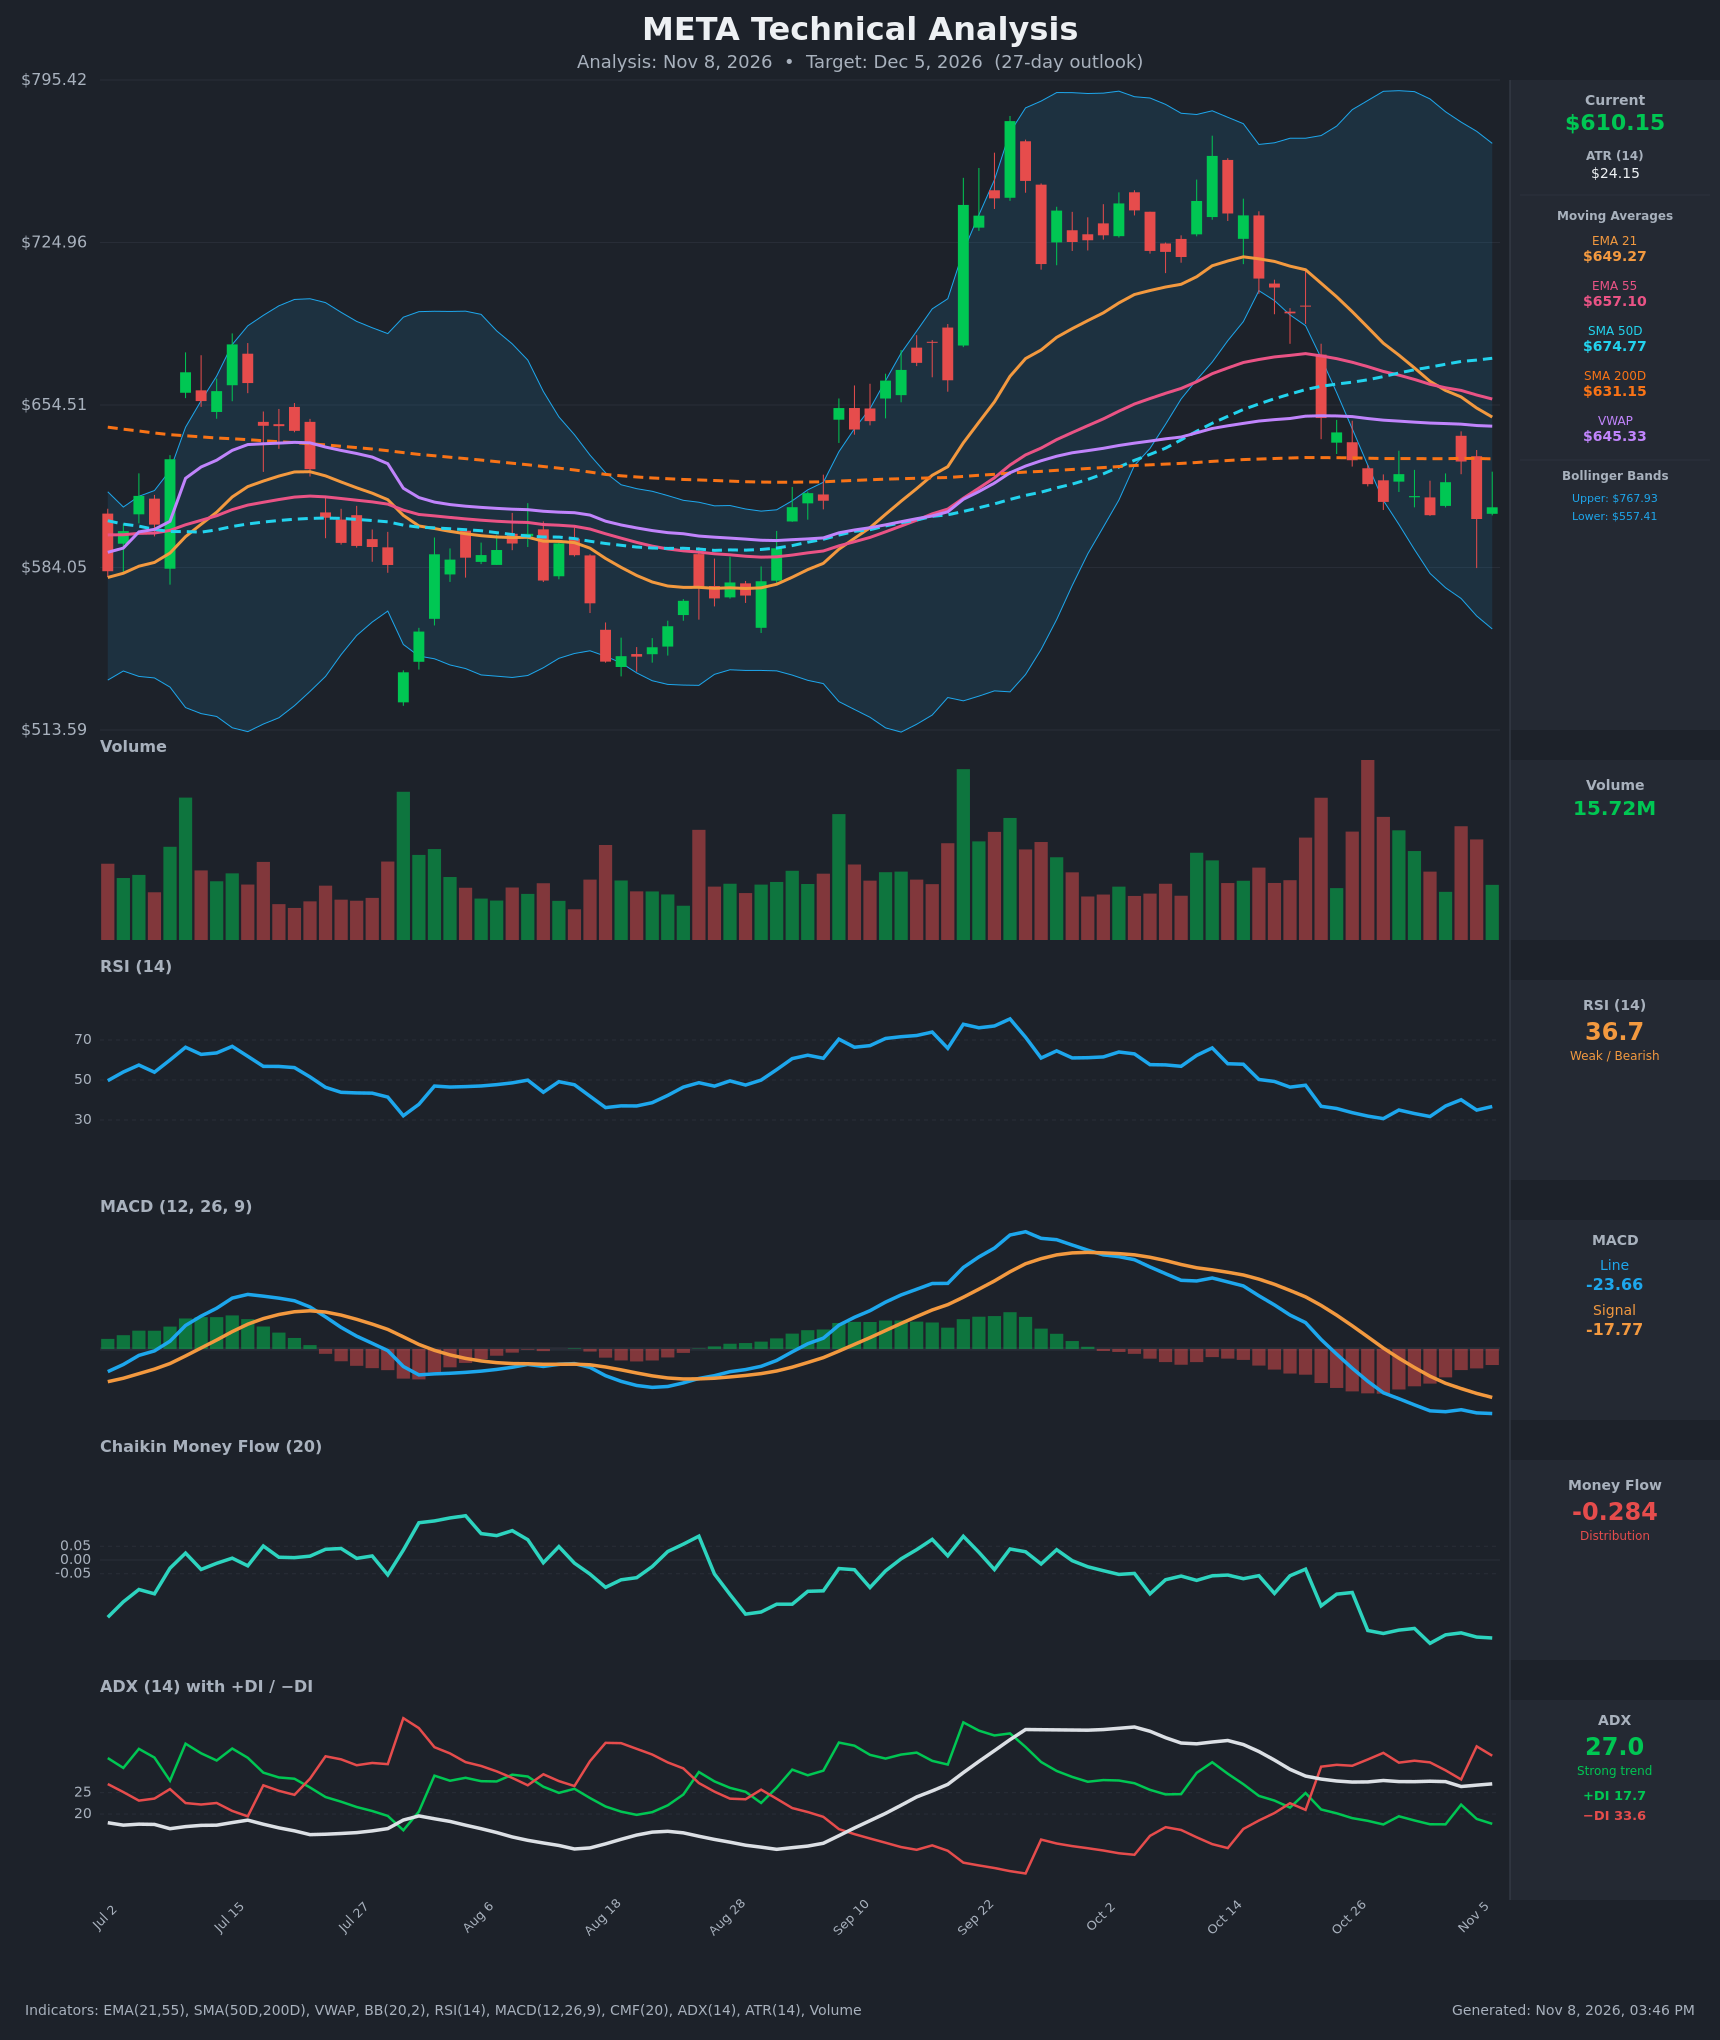
- RSI (14): 36.74, near oversold but not at the <30 extreme. It bottomed around 30.7 on Oct 28 and has chopped between 31 and 40 since, a weak bounce that failed at 40 on Nov 4. Momentum is still bearish, with no bullish divergence. [Bearish]
- 20 EMA: The nearest tracked average is the EMA 21 at $649.27, with the EMA 55 at $657.10. Price at $610.15 is about 6% below the EMA 21, which is sloping down and acting as resistance. The EMA 21 crossed below the EMA 55 around Nov 3-4, a bearish crossover. [Bearish]
- MACD: Line -23.66 is below signal -17.77, with a negative and widening histogram. The bearish crossover happened around Oct 28-29, and both lines are below zero and still falling. [Bearish]
- Bollinger Bands (20): Upper $767.93, lower $557.41, middle about $662. Price is in the lower half, about 25% of the way from the lower to the upper band. The bands are still wide after the September-October volatility, and the lower band is about 8.6% below price. The price has not hit the lower band, so there is no real mean-reversion signal yet. [Bearish]
- CMF (20): -0.284, deeply negative and persistent. It has been below -0.05 for weeks and is making new lows, which signals sustained distribution. [Distribution]
- ADX (14): 27.0 with -DI 33.6 above +DI 17.7. That is a strong trend with bears firmly in control, and the DI spread is wide. ADX is holding above 25, so the downtrend is intact. [Strong Trend - Bearish]
- Volume: 15.72M on the latest bar, moderate. Heavy volume on the large red candles (Oct 22 and the late-October sell-off) points to institutional distribution. Bounces came on lighter volume. [Bearish interpretation]
DIVERGENCES & TRENDS
- No bullish divergence on RSI. The RSI low (30.7) came at a price of $612, and the Nov 5-6 closes near $605-610 have RSI at 35-37, a slightly higher RSI low. This is a very mild positive divergence but unconfirmed.
- MACD and CMF are both making new lows alongside price, so they confirm the downtrend.
- Death cross status: SMA50D ($674.77) is still above SMA200D ($631.15), so no death cross yet. The gap is about $43.6 and narrowing in relative terms as price drops.
- Price is below the EMA 21, EMA 55, SMA50D and VWAP, and just under the SMA200D ($631.15), which has turned from support into resistance.
- The EMA 21 has crossed below the EMA 55, and the SMA50D is rolling over, so a bearish medium-term structure is forming.
- ADX stays above 25 with -DI dominant, so trend strength is confirmed.
CHART PATTERNS
- Bearish Head and Shoulders (broad): The September peak (~$770s) with shoulders around $730-$760 in October, followed by a break below the neckline and the SMA200D, resembles a topping structure. The measured move points toward the low $500s.
- Bearish Flag/Pennant (minor): The small-range consolidation between $605 and $630 after the Oct 22 gap-down looks like a pause within a downtrend. A break below $605 would target roughly $560-$575.
- Support at $605 (the recent lows) and the lower Bollinger Band at $557 are the key tests. The August low zone (~$520-$560) is the major base.
POTENTIAL SCENARIOS
- Scenario 1: Bearish Continuation Lower — The downtrend continues with distribution and a strong ADX, and price breaks the $605 range floor. Trigger: daily close below $605 on rising volume. Target: $560-$575, with an extension to $540. Invalidation: close above $650 (the EMA 21 and the SMA200D zone). (50% probability)
- Scenario 2: Neutral Oversold Consolidation — RSI near 30 and the lower band attract buyers, so price ranges between $570 and $640 and mean-reverts toward the SMA200D. Trigger: hold of $595-$605 with an RSI higher low. Target: $620-$635. Invalidation: close below $590 or above $650. (28% probability)
- Scenario 3: Bullish Relief Rally — A sharp oversold bounce reclaims the SMA200D and the EMA 21. Trigger: close above $632 with MACD histogram contraction. Target: $650-$665 (EMA 21/55, VWAP). Invalidation: rejection at $640 and a drop back under $610. (22% probability)
PRICE TARGETS
For the 27-day timeframe, the width should be ~12-18% of price, so roughly $73-$110. The chosen range is $548 to $641, a $93 width, or 15.2% of the $610.15 price.
- Target Price: $588.00 (27 days)
- Expected Range: $548.00 to $641.00
- Key Levels: Support at $557.41 (lower Bollinger Band; immediate support at $605), Resistance at $631.15 (SMA200D)
OVERALL BIAS
OVERALL BIAS: BEARISH - Price is below all key moving averages and VWAP, with a bearish MACD, an EMA 21/55 bearish cross, deeply negative CMF (-0.284), and ADX 27 with -DI far above +DI. RSI is approaching oversold, which limits downside and makes bounces likely, but the trend and distribution favor a drift toward the $560-$590 area.
This is educational analysis and not financial advice.