INTC 27-day bearish forecast — Nov 8, 2026
- Bias: Bearish
- Timeframe: 27 days (made Nov 8, 2026, target date Dec 4, 2026)
- Price at analysis: $56.28
- Price target: $52.50
- Expected range: $48.50 – $57.00
- Result: Pending — graded after the close on Dec 4, 2026
Get a free AI analysis of INTC today
Analysis
TECHNICAL INDICATORS
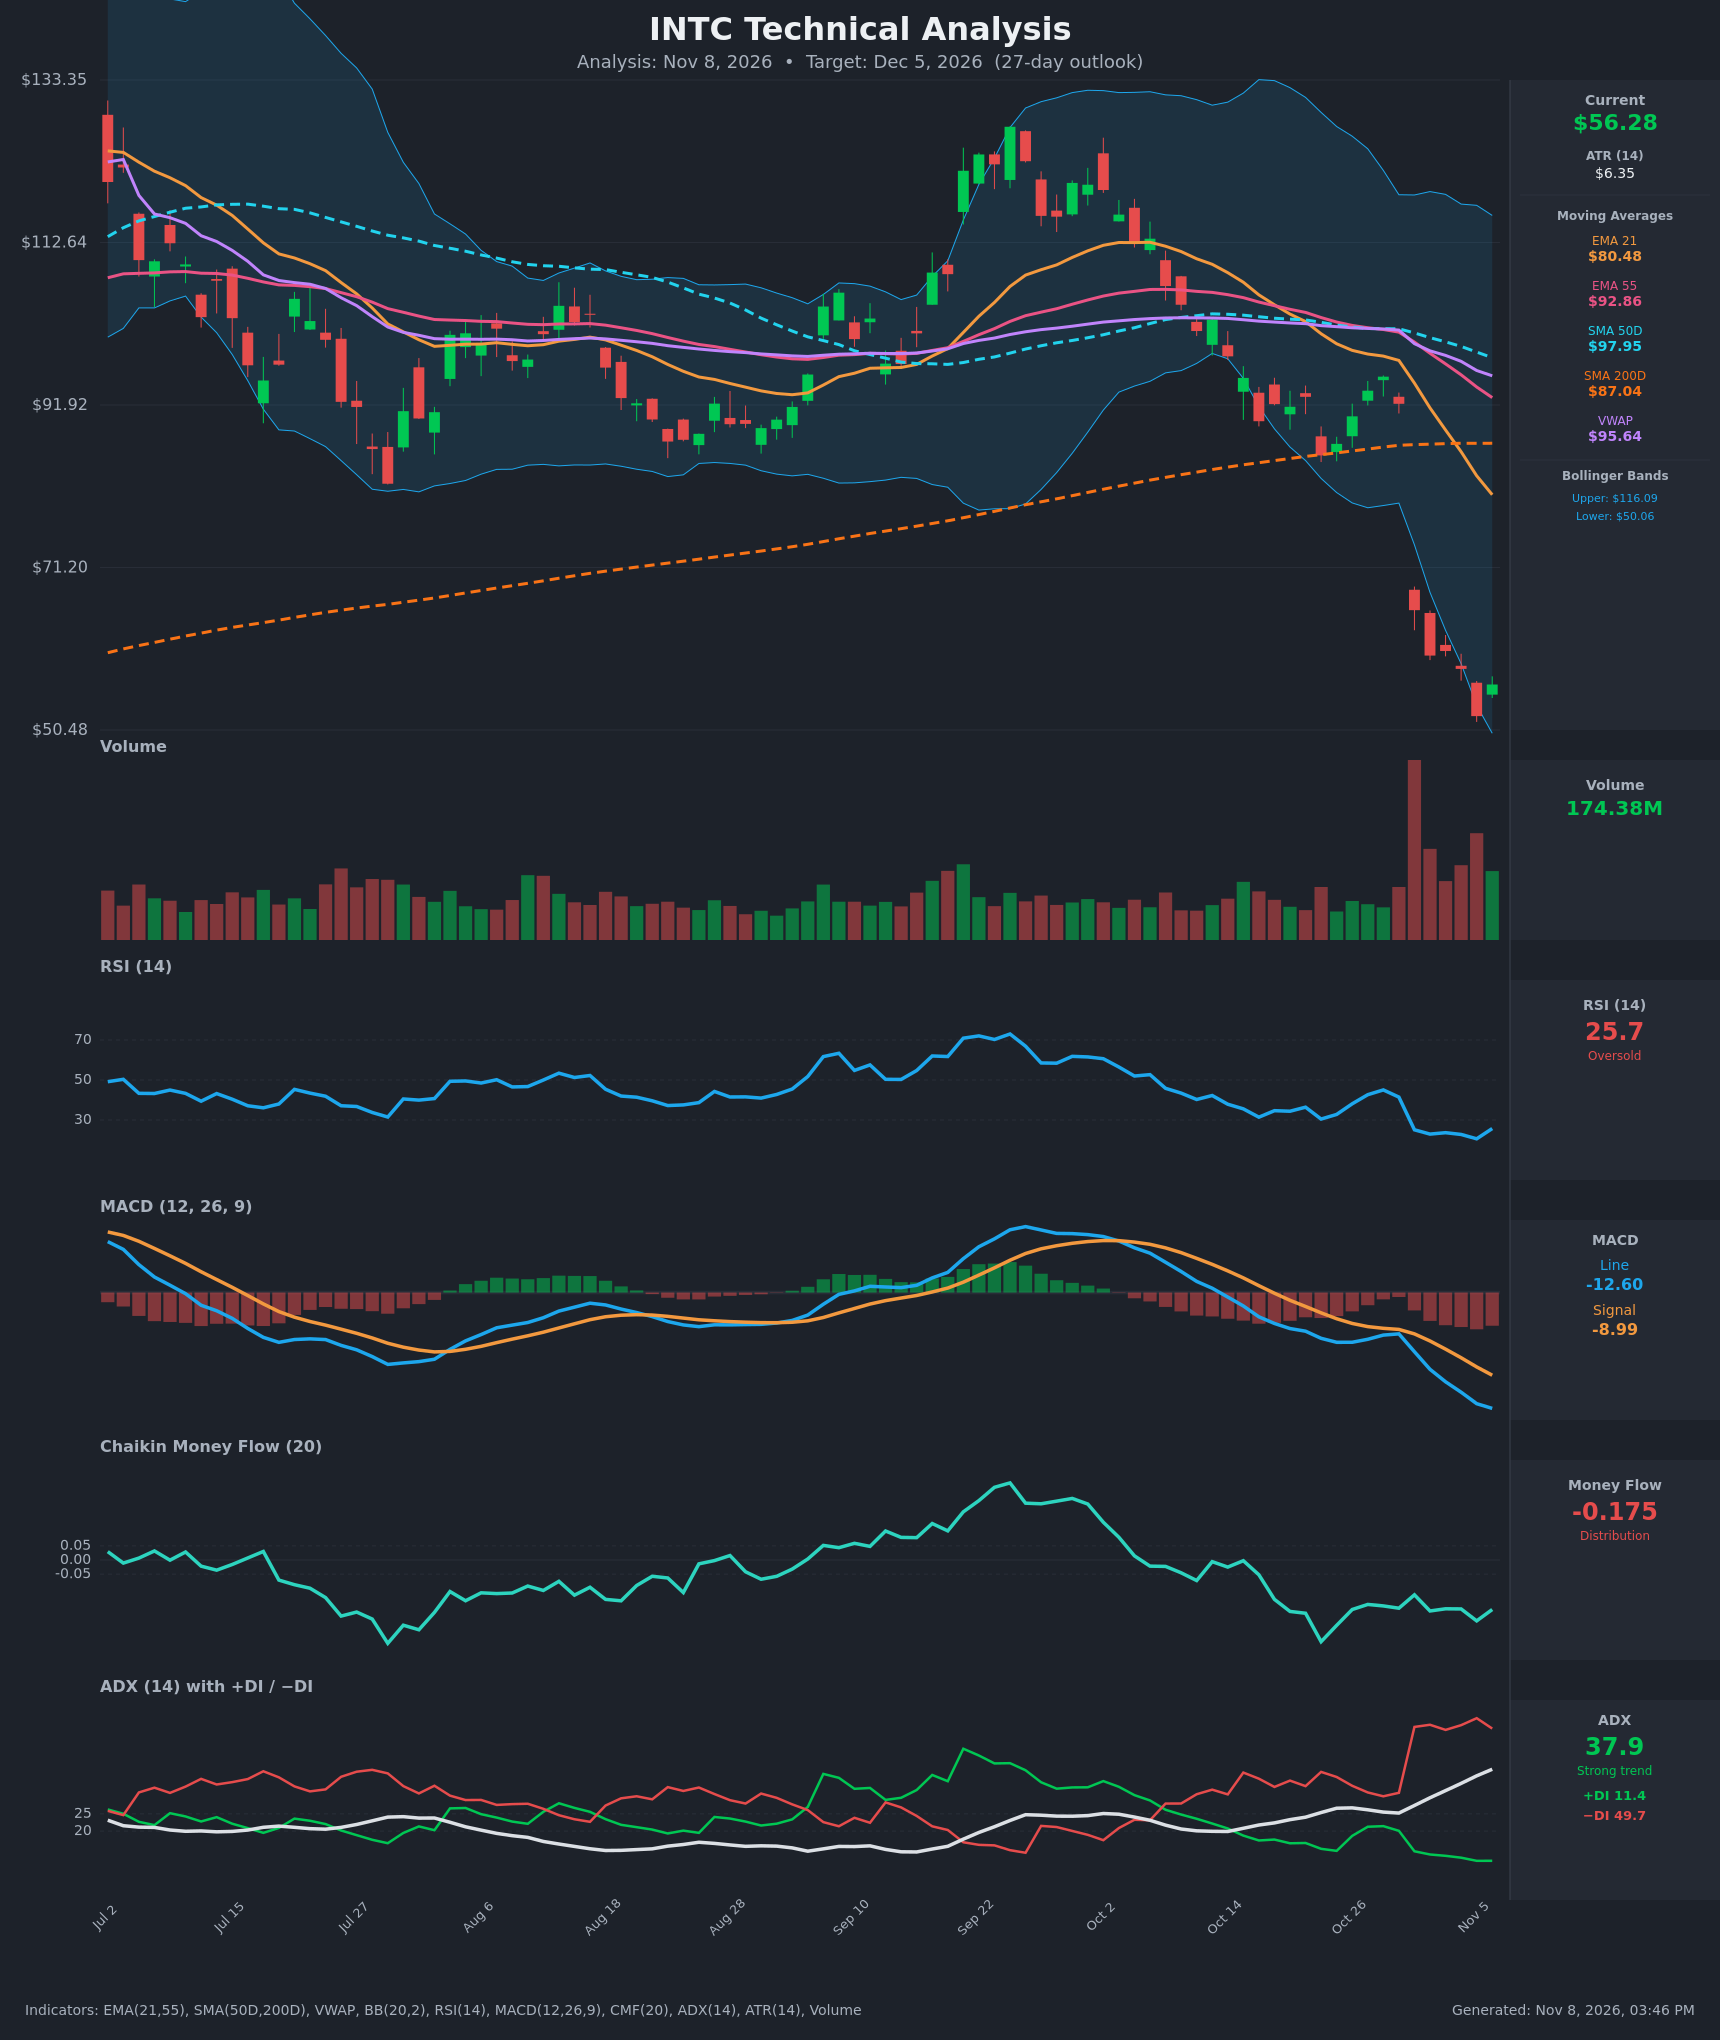
- RSI (14): 25.72, oversold. It bottomed at 20.6 on Nov 5 and ticked up to 25.7 on the latest bounce bar. It has been below 30 for most of the last 7 sessions, which signals a persistent downtrend rather than a one-off dip. A bounce is possible, but no bullish reversal in momentum is confirmed yet. [Neutral]
- 20 EMA: The chart shows the EMA 21 at $80.48. Price at $56.28 is about 30% below it, so it acts as overhead resistance and is falling steeply (from $104.69 on Oct 19). EMA21 crossed below EMA55 ($92.86) around Oct 20, a bearish crossover that is now widening. [Bearish]
- MACD: The line is -12.60 against a signal of -8.99, and the histogram is about -3.6 and still widening. The line has been below the signal for the whole 15-bar window and is making new lows with no sign of a bullish cross. [Bearish]
- Bollinger Bands (20): The upper band is $116.09 and the lower is $50.06, so the bands are very wide after the Oct 30 gap. Price at $56.28 sits in the lower fifth of the range, just above the lower band. The latest low (about $50.5) touched the band and price bounced off it. Walking the lower band in a strong trend is usually continuation, but the touch also raises the odds of a relief bounce toward the mid-band, which is far away. [Bearish]
- CMF (20): -0.175, well below -0.05. It has been persistently negative (-0.12 to -0.29) throughout the decline, which shows sustained distribution with no accumulation. [Distribution]
- ADX (14): 37.9 and rising steadily from 22 to 38. −DI at 49.7 is far above +DI at 11.4. This is a strong, well-established downtrend with bears firmly in control. A rising ADX with −DI dominant means the trend is not yet exhausted. [Strong Trend – Bearish]
- Volume: 174.38M on the latest bar, well above the prior base. The Oct 30 gap-down came on a huge volume spike, and the following sessions stayed elevated, mostly on red candles. The latest bar is green with heavy volume, which could mark early capitulation or buying, but it needs follow-through. [Heavy selling, possible capitulation]
DIVERGENCES & TRENDS
- No bullish divergence yet: Price made a new low on Nov 5 (close $52.25, RSI 20.6). The Nov 6 bounce took RSI to 25.7, but MACD (-12.6) and −DI are still making new extremes, so momentum has not diverged from price.
- Moving average structure: EMA21 < EMA55 (bearish cross on ~Oct 20). SMA50D ($97.95) is still above SMA200D ($87.04), so there is no death cross yet. However, price is far below both, and SMA50D is rolling over, so a death cross is plausible within weeks if there is no recovery.
- Price vs. VWAP/SMA200D: Price is well below VWAP ($95.64) and SMA200D ($87.04), confirming a long-term breakdown after the earlier July–September range. SMA200D had been rising and now sits as a major resistance zone.
- Trend in indicators: ADX is rising, CMF is stuck in distribution, and MACD is accelerating lower. All three confirm the trend rather than warn of reversal.
- Extension: Price is about 30% below EMA21 and at the lower Bollinger Band with RSI in the 20s. This raises the odds of a sharp counter-trend bounce, but such bounces typically stall well below the gap at $65.76 and the falling EMA21.
CHART PATTERNS
- Gap-down breakdown: The Oct 30 collapse from about $92 to $65.76 broke the $85–$90 support area and the SMA200D, which had been defended since July. This looks like the end of a lower-high structure that began at the September peak (about $125–$128).
- Bearish Pennant / Flag (continuation) – tentative: Since Oct 30, price has formed small, tight bounces (about $58–$60) and a lower low at $52.25, a flag-like pause after a steep drop. If it resolves downward, the measured move targets roughly $40s. The base is only a few bars old, so this is low-confidence.
- Bullish counter-case: A Bullish Falling Wedge or Double Bottom would need another test of about $50–$52 that holds on declining volume with RSI divergence. That is not present yet.
- Gap fill zone: $65.76 (the Oct 30 close) is the first real resistance for any bounce. $60.55 (Nov 3 close) is nearer.
POTENTIAL SCENARIOS
- Scenario 1: Bearish Trend Continuation — Sellers remain in control (−DI at 49.7, ADX rising, CMF distribution). Price makes a weak bounce into $58–$60, fails, and rolls over to retest and possibly break the $50.5 low and the lower Bollinger Band. Trigger: daily close below $52.25 and then $50.50, with MACD still falling. Target: $50–$52.50 first, with extension to $46–$48. Invalidation: daily close above $60.55 with RSI above 40. (50% probability)
- Scenario 2: Bullish Oversold Relief Bounce — RSI at 20–25 with price at the lower band and a green reversal candle on heavy volume points to capitulation. Price squeezes back toward the gap and the Nov 3 level before sellers return. Trigger: close above $60.55 on rising volume with MACD histogram contracting. Target: $62–$66, with $65.76 as the gap-fill cap. Invalidation: close back below $52.25. (35% probability)
- Scenario 3: Neutral Base-Building Range — After the shock, price chops between about $50.50 and $60 as volatility compresses and ADX rolls over. Trigger: several sessions of inside-range closes on falling volume. Target: $54–$58. Invalidation: close outside $50.50–$60.55. (15% probability)
PRICE TARGETS
Timeframe: 27 days (about 15% range width, which falls between the 14-21 day and 30-60 day guidance).
- Target Price: $52.50 (27 days)
- Expected Range: $48.50 to $57.00 ($8.50 wide, about 15.1% of current price)
- Key Levels: Support at $50.48 (recent low and lower Bollinger Band area), Resistance at $60.55 (Nov 3 close; next resistance at the $65.76 gap)
OVERALL BIAS
OVERALL BIAS: BEARISH - The trend indicators (EMA21 < EMA55, MACD widening below signal, ADX 37.9 with −DI 49.7 vs +DI 11.4, CMF -0.175) all favor continuation after the gap-down breakdown, while the oversold RSI and lower-band touch argue only for a bounce that is likely to be capped near $60. Conviction is moderate because of the elevated bounce risk.
This is educational analysis and not financial advice.