MU 27-day bearish forecast — Nov 8, 2026
- Bias: Bearish
- Timeframe: 27 days (made Nov 8, 2026, target date Dec 4, 2026)
- Price at analysis: $690.00
- Price target: $655.00
- Expected range: $605.00 – $715.00
- Result: Pending — graded after the close on Dec 4, 2026
Get a free AI analysis of MU today
Analysis
TECHNICAL INDICATORS
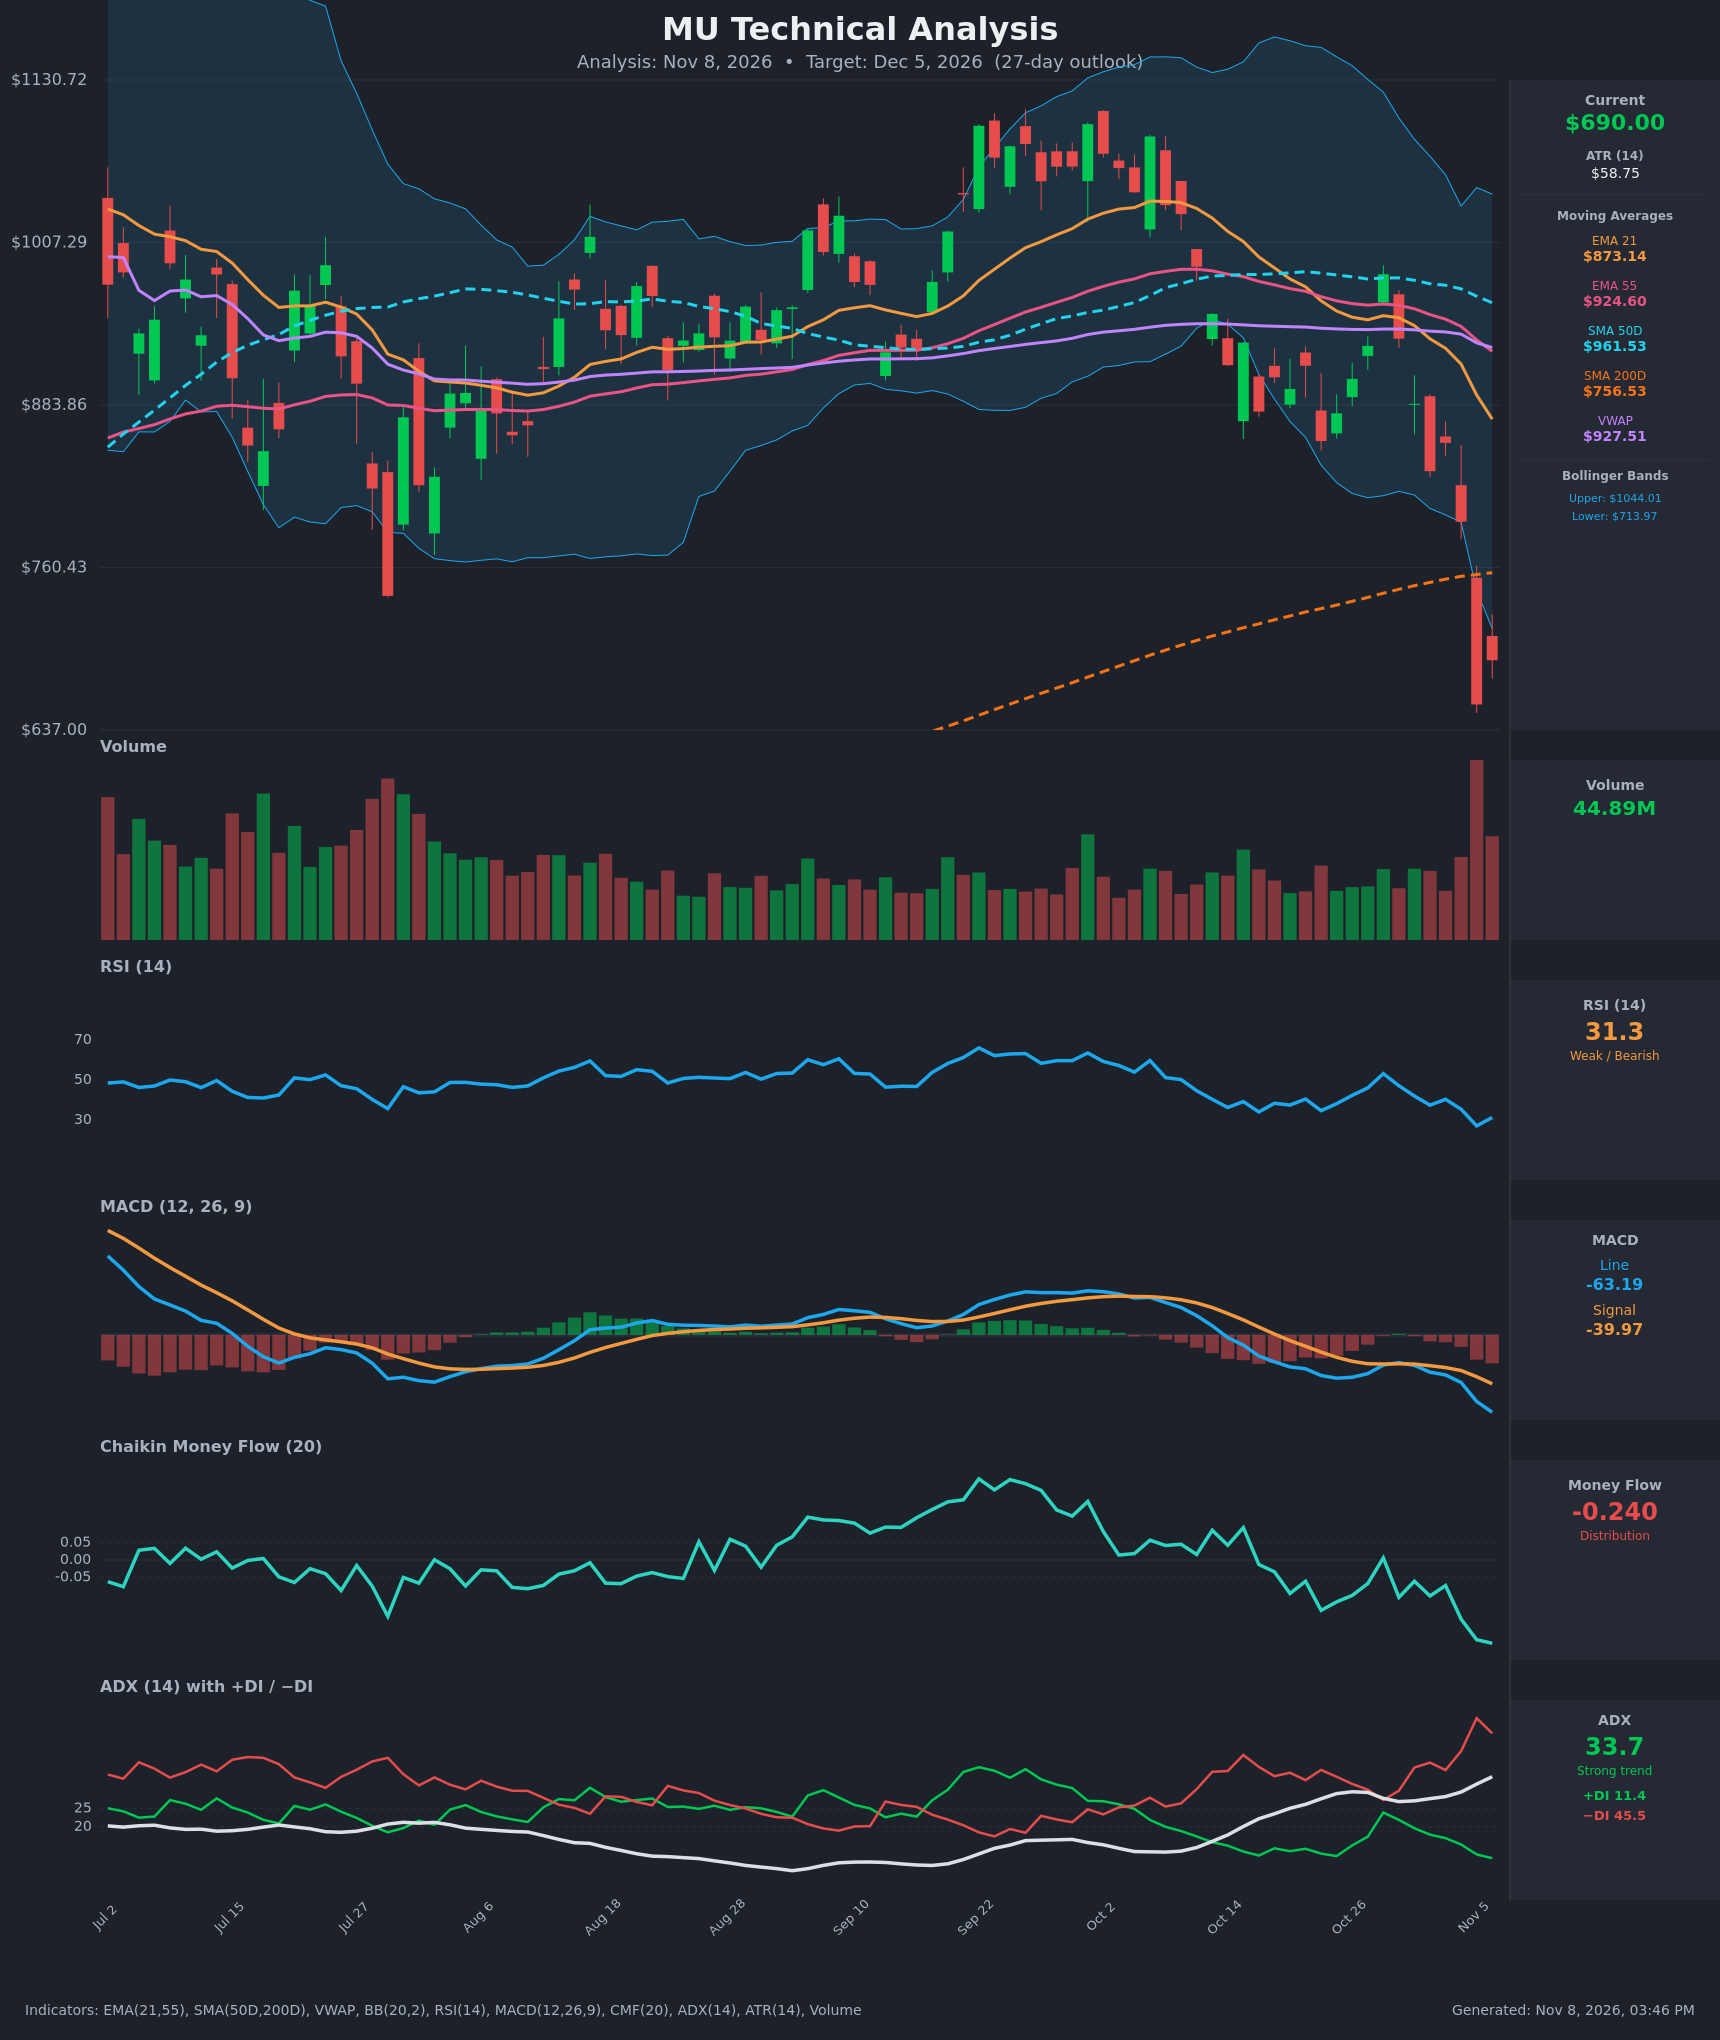
- RSI (14): 31.27, just above oversold. It fell from 53 on Oct 28 and hit 27.1 on Nov 5, and the small bounce to 31 hasn't changed the downtrend. Momentum is weak and still pointing down. [Bearish]
- 20 EMA (EMA 21): $873.14, with EMA 55 at $924.60. Price at $690 is about 21% below the EMA 21, so the average is heavy overhead resistance. EMA 21 crossed below EMA 55 around Oct 22 and the gap keeps widening. [Bearish]
- MACD: Line -63.19 vs signal -39.97. The line crossed below the signal in the Oct 19-20 area and the gap is widening (histogram about -23 and growing). Both lines are below zero and accelerating lower. [Bearish]
- Bollinger Bands (20): Upper $1044.01, lower $713.97. Price at $690 closed below the lower band after a plunge to $656 on Nov 5. The bands are expanding, which suggests a volatility-driven trend move rather than a squeeze. An oversold bounce is possible, but a close outside the band in a strong trend often means "walking the band". [Bearish]
- CMF (20): -0.240, deep in distribution and falling steadily from +0.20 in late September. Sellers are dominant and there is no sign of accumulation yet. [Distribution]
- ADX (14): 33.7 and rising, with −DI (45.5) far above +DI (11.4). This is a strong, accelerating downtrend with bears firmly in control. [Strong Trend – Bearish]
- Volume: 44.89M on Nov 6, after a huge volume spike on the Nov 5 breakdown candle (the largest bar on the chart). Heavy volume on the down leg confirms the selling. Part of it may be capitulation, but the bounce on Nov 6 came on lighter volume. [Bearish confirmation, possible capitulation]
- VWAP / SMAs: Price is below VWAP ($927.51), SMA50D ($961.53) and EMA 55. It also closed below SMA200D ($756.53) for the first time in this window, which is a major long-term support loss. SMA50D is still above SMA200D, so there is no death cross yet, but the 50-day is rolling over. [Bearish]
DIVERGENCES & TRENDS
- There is no bullish RSI divergence yet. RSI made a lower low (27.1) with price at a new low, so momentum confirms price.
- The MACD histogram is expanding negatively and CMF is making new lows, so both are in line with the downtrend.
- The trend is clear: price fell from $983 (Oct 28) to $656 (Nov 5), about -33% in 6 sessions. It lost the EMA 21, EMA 55, VWAP and SMA50D in sequence, then broke SMA200D and the lower Bollinger Band.
- Bearish crossovers are in place: EMA 21 under EMA 55, MACD under signal, and −DI far above +DI. The remaining risk is a death cross (SMA50D falling toward SMA200D), which is not yet confirmed.
- The only counter-signals are the oversold RSI and the stretch below the lower band (extreme extension from the 21 EMA). These point to a likely relief bounce, not a trend reversal.
CHART PATTERNS
- Bearish Double Top (large scale): Peaks near $1,090 in September and October, with a support zone around $850–$880 acting as the neckline. The Nov 4–5 breakdown through that zone confirms the pattern. The measured move (about $230–240 of height) projects to roughly $610–$640.
- Bearish continuation structure: After the gap-like drop, a weak bounce into $750–$800 (the SMA200D / former support zone) would resemble a bearish flag or pennant. A failed bounce would extend the measured move.
- There is no confirmed bullish reversal pattern (no double bottom or inverted head and shoulders). A single capitulation candle is not enough.
POTENTIAL SCENARIOS
- Scenario 1: Bearish Trend Continuation — Price stays below the SMA200D and the falling EMAs, and sellers keep control (−DI dominant, CMF negative). Price re-tests and breaks the Nov 5 low, then drifts toward the double-top measured move. Trigger: Close below $656. Target: $610–$640, with extension to about $600. Invalidation: Daily close above $756.53 (SMA200D). (50% probability)
- Scenario 2: Neutral/Bullish Relief Bounce, Then Fail — Oversold RSI and the band stretch trigger a dead-cat bounce into $740–$790 (SMA200D and the gap zone). Heavy supply caps the bounce and price rolls over, ending the 27 days near or below the current level. Trigger: Hold above $656 and reclaim $714 (lower BB). Target: $740–$790 for the bounce, then fade to $680–$700. Invalidation: Sustained close above $800. (33% probability)
- Scenario 3: Bullish V-Shaped Reversal — The Nov 5 candle proves to be capitulation. Buyers reclaim the SMA200D and push toward EMA 21. Trigger: Daily close above $756.53 on rising volume, with CMF turning up. Target: $830–$870 (EMA 21 area). Invalidation: Close back below $700. (17% probability)
PRICE TARGETS
- Target Price: $655.00 (27-day outlook, modest downside as the trend continues, tempered by oversold bounce risk)
- Expected Range: $605.00 to $715.00 (width $110 ≈ 15.9% of the current price, in line with 12–18% guidance for this horizon)
- Key Levels: Support at $640.00 (Nov 5 capitulation low area), Resistance at $756.53 (SMA200D, now acting as resistance)
OVERALL BIAS
OVERALL BIAS: BEARISH - The −DI/+DI gap is large with ADX rising, price has broken below all major moving averages and the SMA200D, CMF shows heavy distribution, and MACD is accelerating lower. Oversold conditions make a bounce likely, but the trend and the double-top breakdown favor lower prices over the next 27 days.
This is educational analysis and not financial advice.