USO 27-day bearish forecast — Nov 8, 2026
- Bias: Bearish
- Timeframe: 27 days (made Nov 8, 2026, target date Dec 4, 2026)
- Price at analysis: $148.41
- Price target: $142.00
- Expected range: $130.00 – $154.00
- Result: Pending — graded after the close on Dec 4, 2026
Get a free AI analysis of USO today
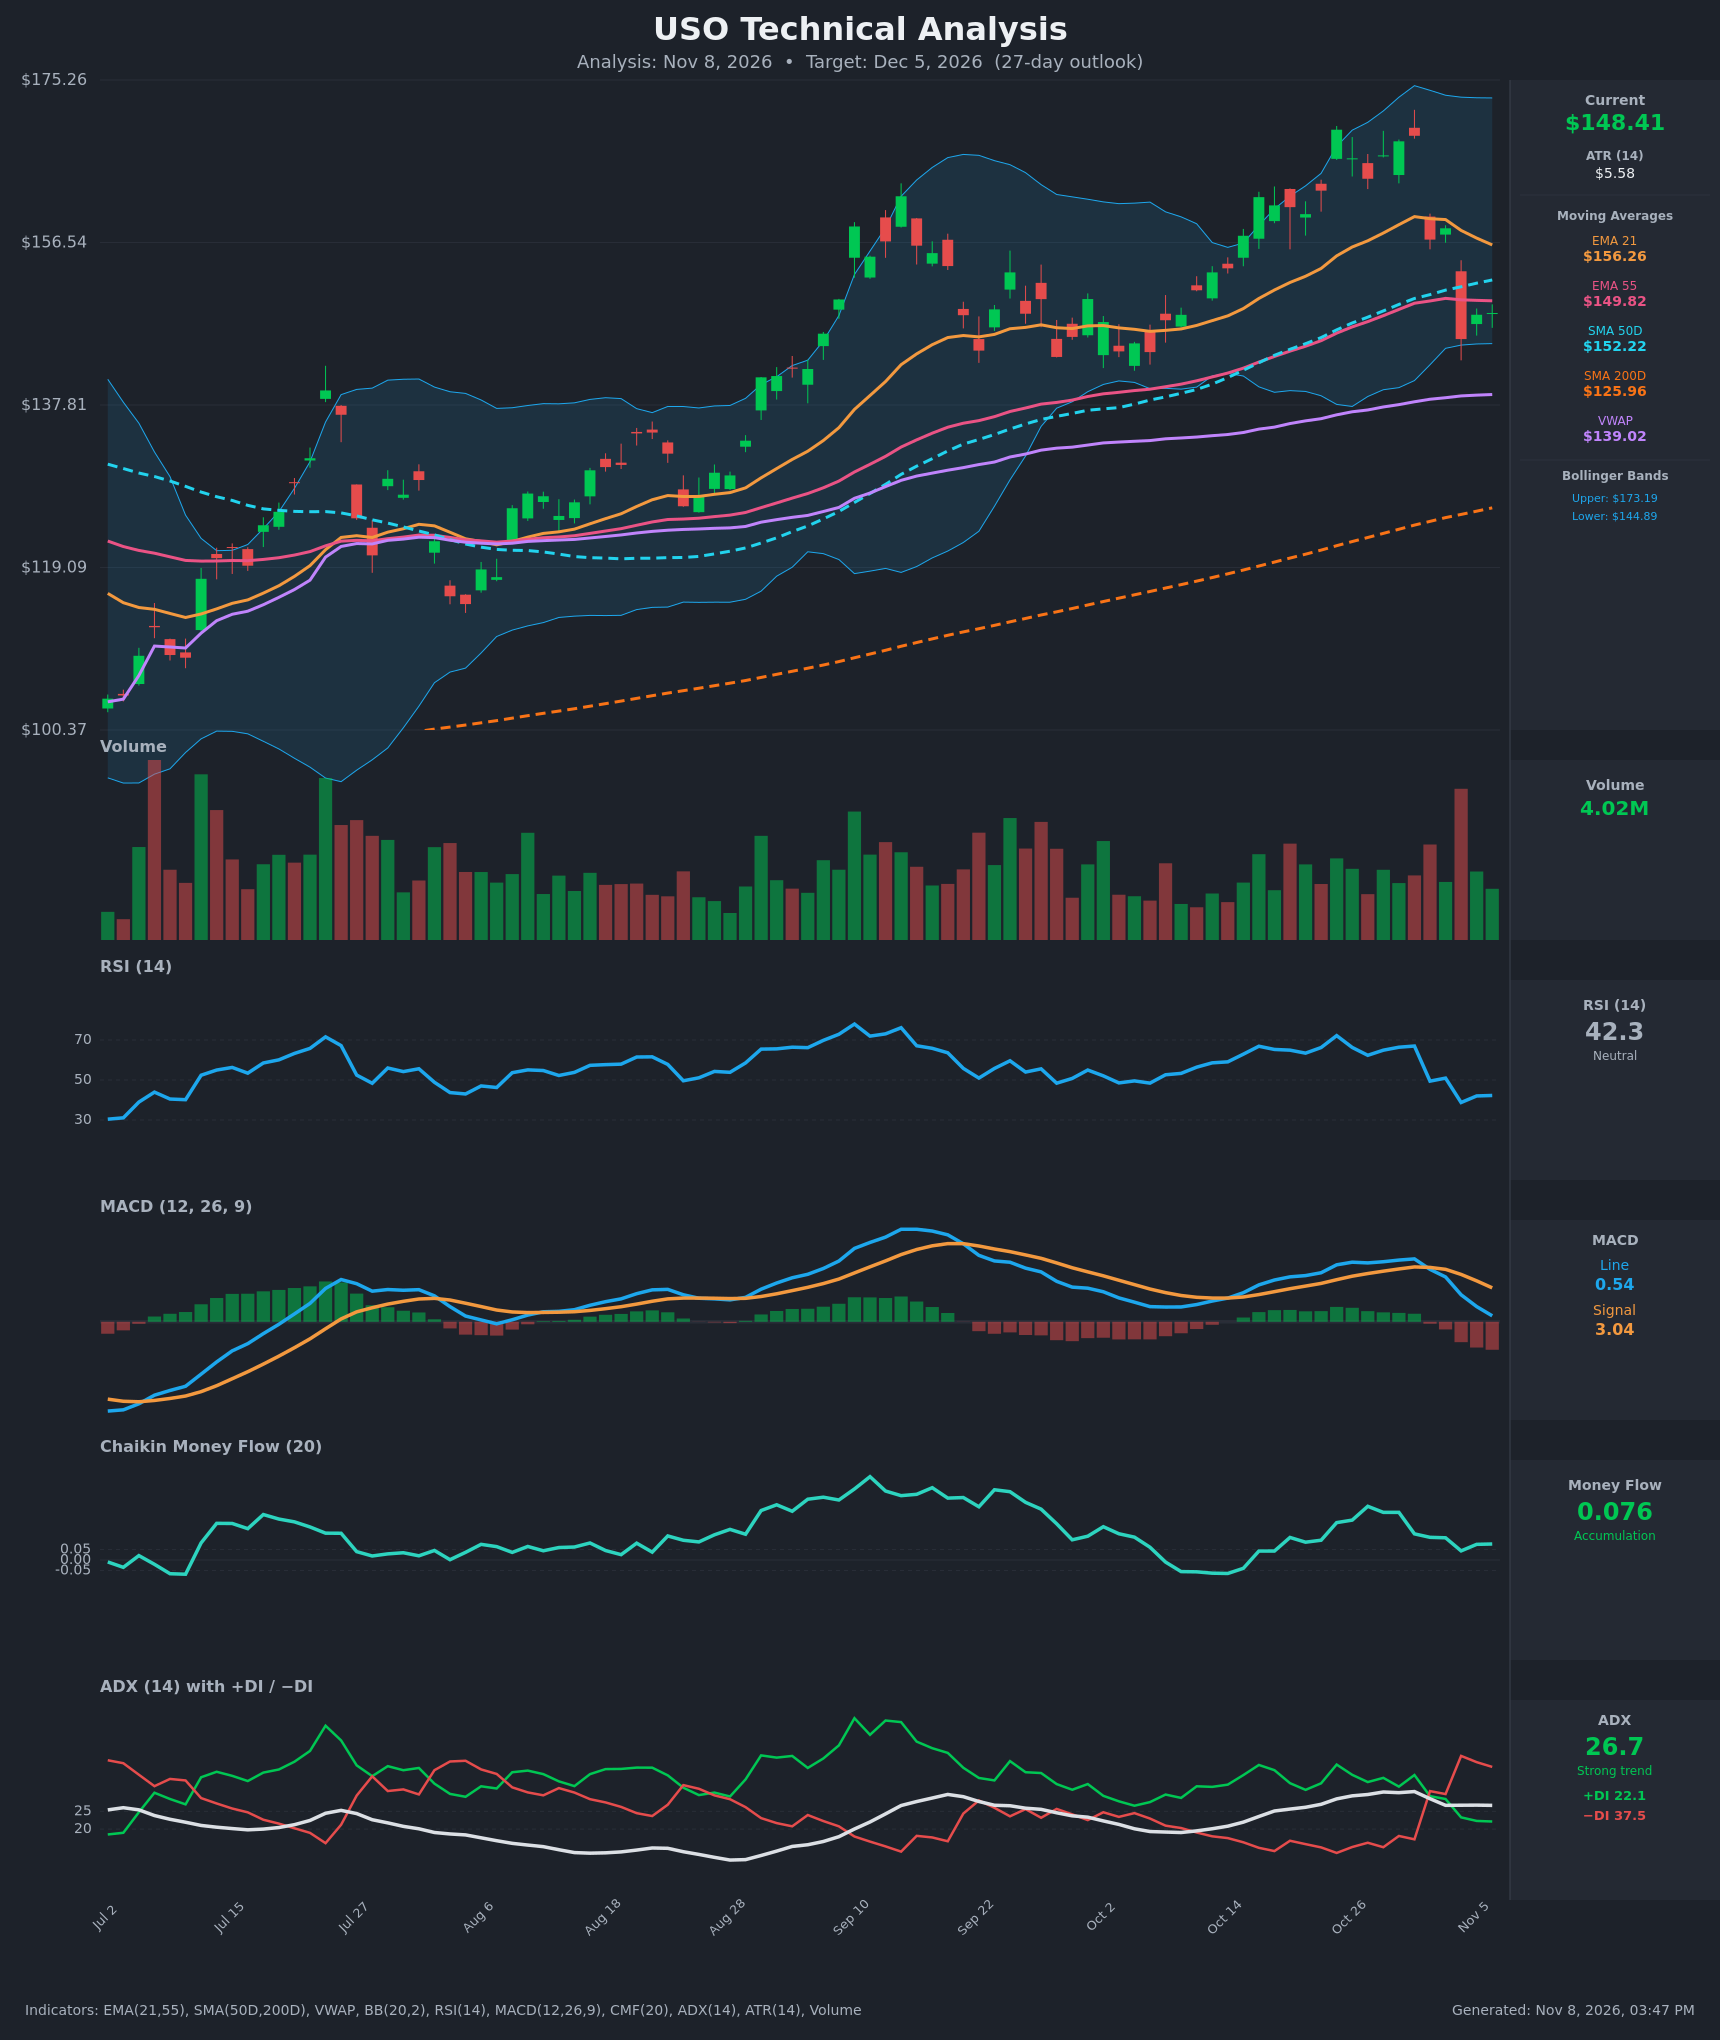
Analysis
TECHNICAL INDICATORS
- RSI (14): 42.27. It fell from 67 on Oct 30 to 38.8 on Nov 4 and has only bounced slightly. Momentum is weak but not oversold, and the reading is below 50. [Bearish]
- 20 EMA (EMA 21 = $156.26): Price at $148.41 is about 5% below the EMA 21, and the EMA 21 is now rolling over from its $159.52 peak. It acts as overhead resistance. Price is also just below the EMA 55 ($149.82) and the SMA 50D ($152.22). [Bearish]
- MACD: The line (0.54) crossed below the signal (3.04) around Nov 2. The histogram is negative and widening, and the line is heading toward zero. This is a fresh bearish crossover with accelerating downside momentum. [Bearish]
- Bollinger Bands (20): Upper $173.19, lower $144.89. Price is in the lower quarter of the band, about $3.50 above the lower band, after a sharp move down from the upper half. The mid-band (about $159) is the first resistance. The bands are wide, so volatility is elevated. [Bearish]
- CMF (20): 0.076, slightly above +0.05. Accumulation is still positive but has faded from 0.256 on Oct 27. The Nov 4 flush bar only dented it. This is the one supportive indicator, and it is weakening. [Accumulation]
- ADX (14): 26.7 with −DI 37.5 over +DI 22.1. The trend is strong, and the DI crossover on Nov 2 puts the bears in control. ADX is flat at about 27 even though −DI is rising sharply, so the down-leg is the dominant short-term trend. [Strong Trend – Bearish]
- Volume: 4.02M on the latest bar, which is moderate. The large red volume spike on Nov 4 (about $12.8 drop) was a high-volume breakdown bar. The follow-through bounces came on lighter volume. [Bearish – distribution on the breakdown]
DIVERGENCES & TRENDS
- There is no clear RSI or MACD divergence. RSI made lower highs below 70 in late October while price made higher highs ($169.53 on Oct 23, $168.83 on Oct 30), a mild bearish divergence that resolved with the Nov 4 drop.
- MACD has crossed bearishly and is falling toward the zero line. A zero-line break would confirm a larger correction.
- The DI crossover (−DI over +DI) on Nov 2 confirms the trend change from up to down in the short term.
- Price has dropped below the EMA 21 and SMA 50D and sits at the EMA 55. A close below the EMA 55 and SMA 50D would be a meaningful break. The SMA 50D ($152.22) is well above the SMA 200D ($125.96), so no death cross is in play and the long-term trend is still up.
- Price remains well above VWAP ($139.02) and the SMA 200D, so the larger uptrend is intact and this is a pullback inside it.
- CMF is positive and diverges mildly from the bearish price and momentum readings, which suggests dip buyers are present.
CHART PATTERNS
- The October rally to $169–$170 followed by a lower high and a sharp drop resembles a Bearish Double Top. The two peaks are about $169.53 on Oct 23 and $168.83 on Oct 30, with the neckline around $145–$148. Price is now testing that neckline area (the lower Bollinger Band at $144.89 and the Nov 4 low near $145).
- The measured move from a double top is peak minus neckline, roughly $169 − $146 = $23, which points to about $123–$125. That is near the SMA 200D, so I treat it as a distant, stretched target rather than the base case.
- A loss of $144.89 would confirm the pattern, with interim support near $138–$140 (VWAP at $139.02 and the Sep–Oct consolidation base).
- The big picture from July is an uptrend in a rising channel, with the September peak and the October peak both near $160–$170. The pullback could be a correction within the channel, so the double-top case is not yet fully confirmed.
POTENTIAL SCENARIOS
- Scenario 1: Bearish Double-Top Confirmation / Pullback to VWAP — Price fails at the EMA 55 and SMA 50D, breaks the $144.89 lower band and the Nov 4 low near $145, and drifts toward the $135–$140 zone (VWAP and the prior base). Trigger: daily close below $144.50 on rising volume. Target: $137–$140, with an extension to $130 if momentum accelerates. Invalidation: daily close above $153 (the SMA 50D). (50% probability)
- Scenario 2: Neutral Range Chop — The lower band and neckline hold, and price consolidates between about $142 and $155 as the 21 EMA rolls down and the MACD resets toward zero. Trigger: holds above $144 with RSI stabilizing near 40–45. Target: $146–$152. Invalidation: close below $142 or above $156. (28% probability)
- Scenario 3: Bullish Dip-Buy Rebound — CMF accumulation and the long-term uptrend produce a bounce back through the SMA 50D and EMA 21 toward the mid-Bollinger band. Trigger: close above $153 with RSI above 50. Target: $158–$162. Invalidation: close below $144. (22% probability)
PRICE TARGETS
- Target Price: $142.00 (27-day horizon; a moderately bearish drift, given −DI dominance, the MACD cross below signal, and price below the EMA 21 and SMA 50D, offset by CMF support and the uptrend above the SMA 200D)
- Expected Range: $130.00 to $154.00 (width $24 ≈ 16.2% of current price, consistent with the 30–60 day guidance of ~12–18% and well above what a 3- or 14-day range would be; the ATR of $5.58 and the elevated volatility also justify it)
- Key Levels: Support at $144.89 (lower Bollinger Band / Nov 4 low area), with deeper support at $139.02 (VWAP). Resistance at $149.82 (EMA 55), then $152.22 (SMA 50D) and $156.26 (EMA 21).
OVERALL BIAS
OVERALL BIAS: BEARISH - MACD has crossed below its signal line, −DI (37.5) dominates +DI (22.1) with ADX above 25, RSI is below 50, and price is below the EMA 21 and SMA 50D, with a potential double top forming. The long-term uptrend above the SMA 200D and the positive CMF limit the downside, so conviction is moderate.
This is educational analysis and not financial advice.