ASTS 34-day bearish forecast — Nov 8, 2026
- Bias: Bearish
- Timeframe: 34 days (made Nov 8, 2026, target date Dec 11, 2026)
- Price at analysis: $32.33
- Price target: $28.50
- Expected range: $26.00 – $32.00
- Result: Pending — graded after the close on Dec 11, 2026
Get a free AI analysis of ASTS today
Analysis
TECHNICAL INDICATORS
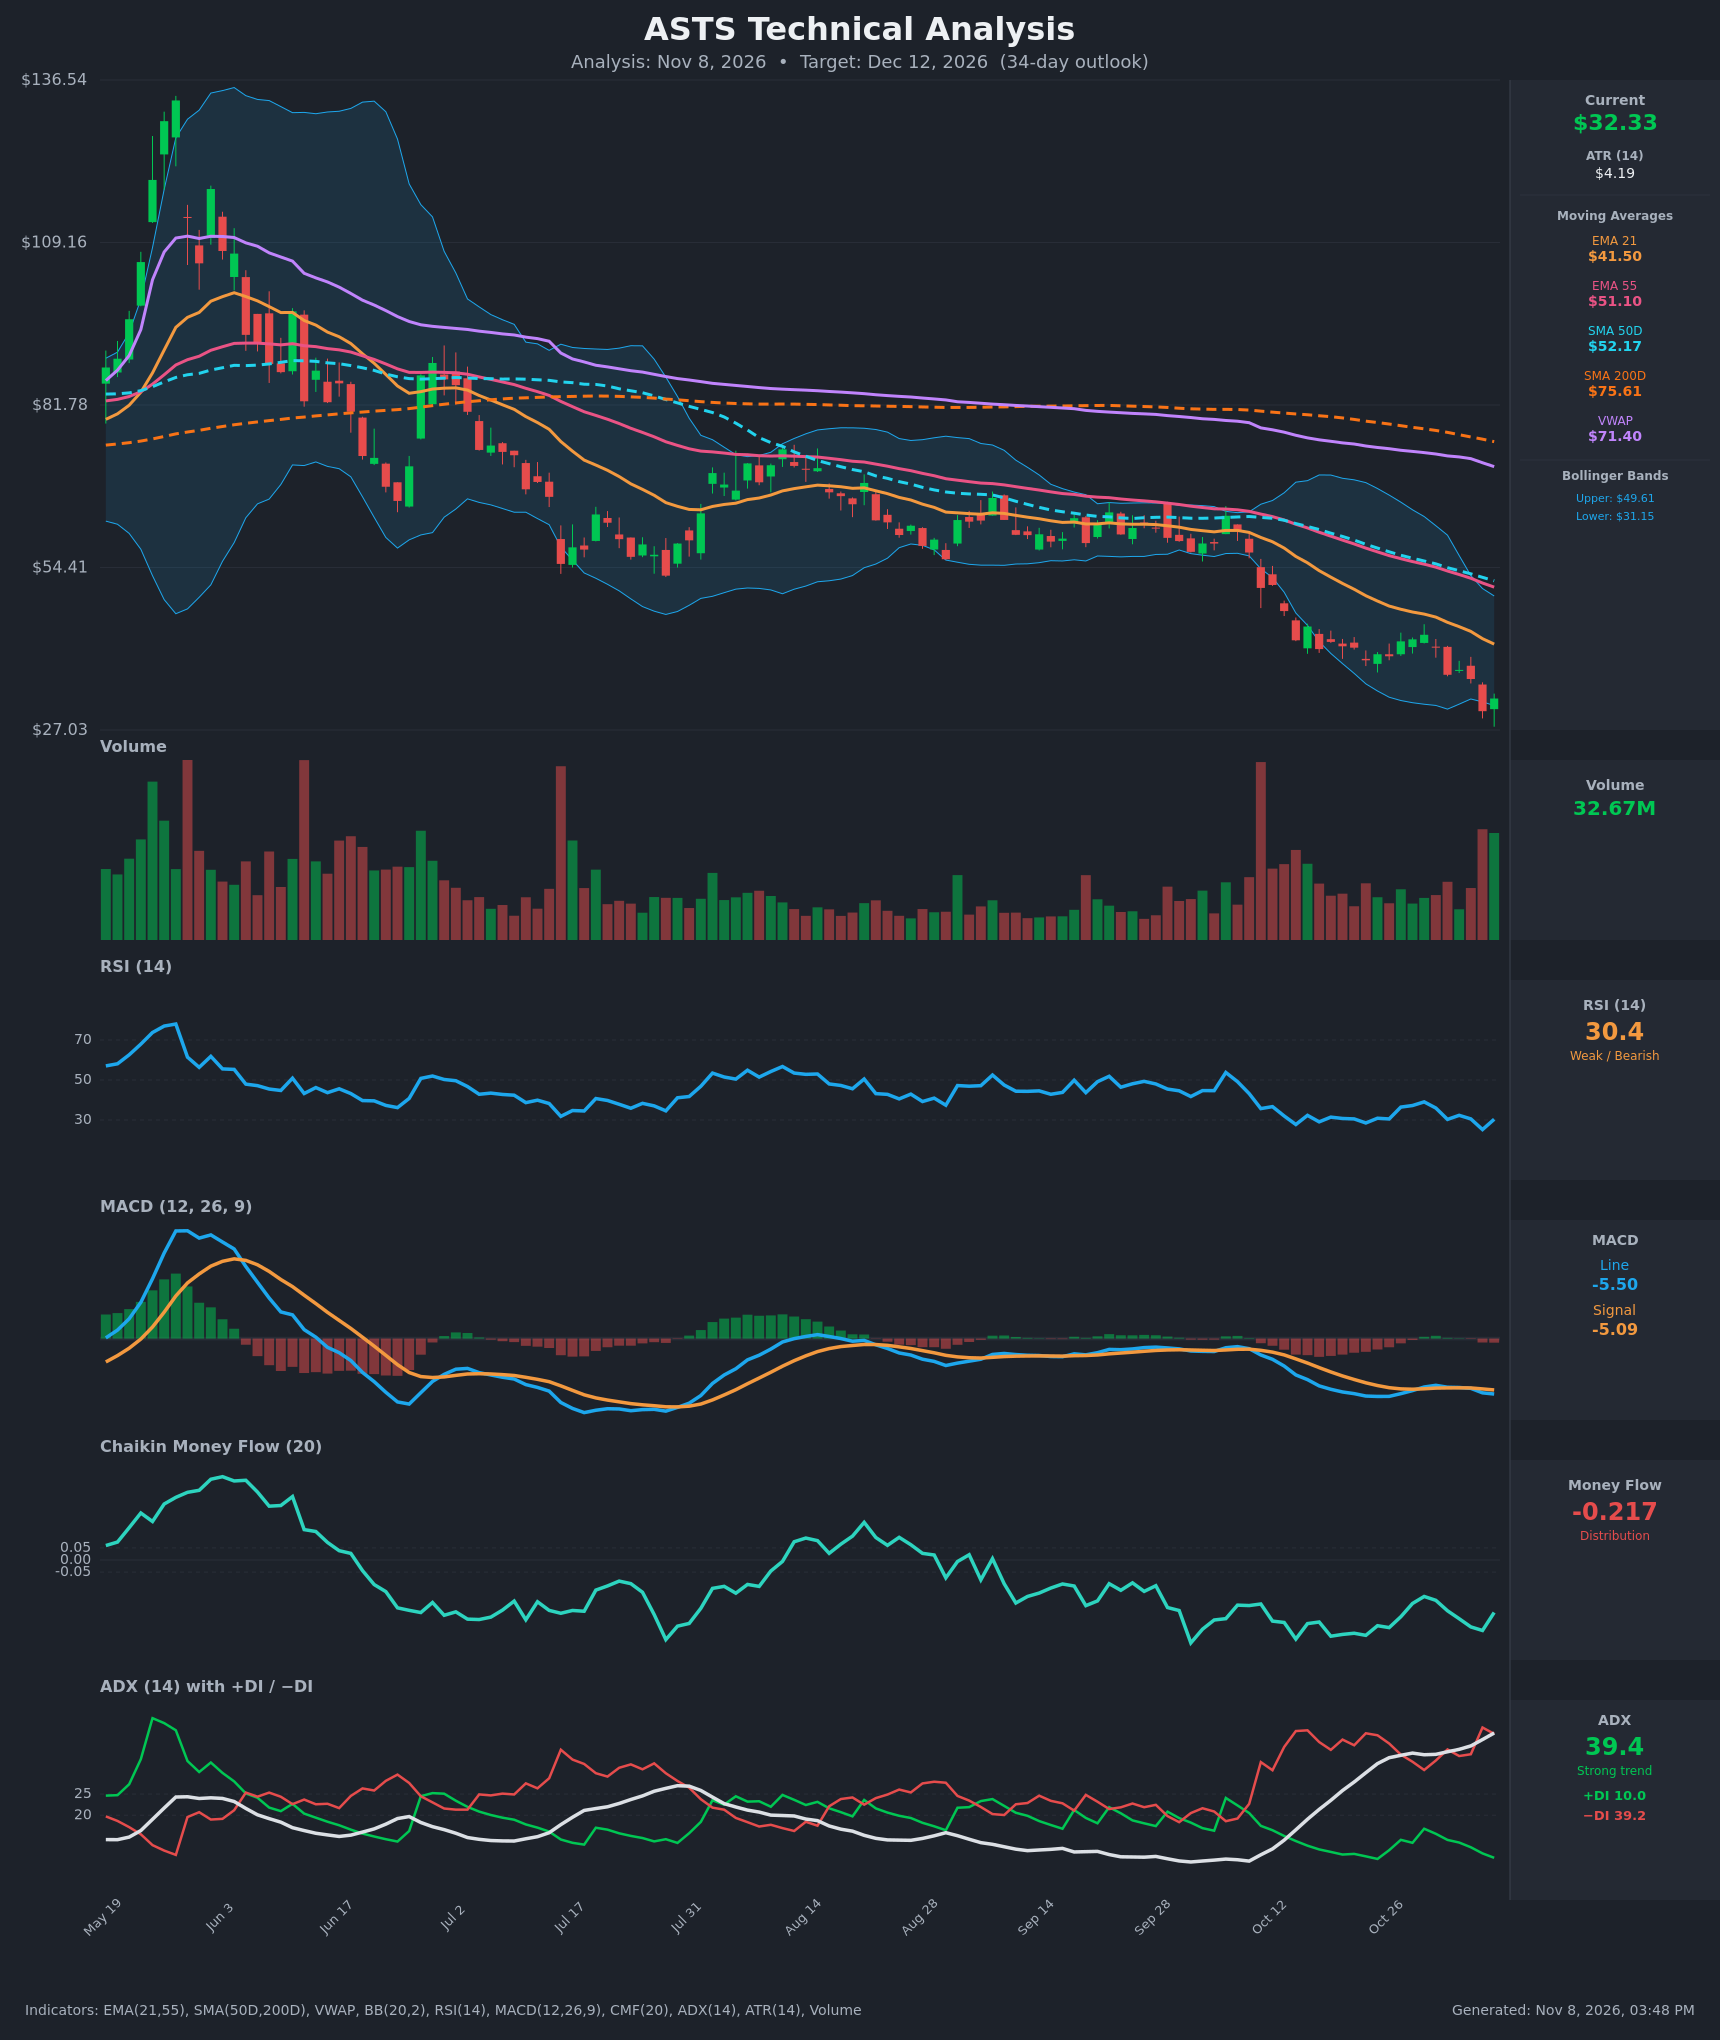
- RSI (14): 30.36, right at the oversold line. It dipped to 25.2 on Nov 5 and bounced, but has been stuck between 25 and 39 for weeks without a real recovery. There is no bullish divergence, since price made a new low along with RSI. [Bearish]
- 20 EMA: The 21 EMA is $41.50 and the 55 EMA is $51.10, so price is about 22% below the 21 EMA. The 21 is well below the 55, and both are falling steeply. Both act as overhead resistance. [Bearish]
- MACD: The line is -5.495 and the signal is -5.090. The line crossed back below the signal on Nov 5, ending a brief Oct 28 to Nov 2 improvement. The histogram is slightly negative and widening, so momentum is weak and deteriorating. [Bearish]
- Bollinger Bands (20): The bands are $31.15 to $49.61, and price at $32.33 sits just above the lower band after riding it for weeks. It is a "band walk" with the bands expanding downward, which signals trend continuation. A bounce to the mid-band (about $40) is possible but would be countertrend. [Bearish]
- CMF (20): -0.217, well below -0.05. It has been negative for months and never recovered above zero, which means sustained distribution. [Distribution]
- ADX (14): 39.4 and rising, a strong trend. -DI is 39.2 against +DI at 10.0, so sellers are firmly in control. ADX this high with a one-sided DI spread supports continuation, though readings above 40 can precede exhaustion. [Strong Trend - Bearish]
- Volume: 32.67M on the latest bar. Volume is elevated, with recent spikes on the Nov 5 breakdown and the bounce bar. This looks like possible capitulation or climactic selling, but there is no confirmed reversal yet. [Heavy selling with bounce attempt]
DIVERGENCES & TRENDS
- Price is below every key average, with SMA50D ($52.17) well under SMA200D ($75.61), a death cross that has been in place for months. EMA21 is below EMA55, and VWAP ($71.40) is more than 2x the price, so buyers are deeply underwater.
- There is no bullish divergence. RSI and MACD both made lower lows with price, so momentum confirms the decline.
- The MACD line crossed below its signal again on Nov 5, and −DI is far above +DI. The DI spread (about 29 points) is wide.
- Oct 27 to 30 showed a failed relief rally. Price rose to $43.07 (RSI 39) and reversed below the falling 21 EMA, which shows how heavy overhead supply is.
- Oversold conditions (RSI 30, price at the lower band) raise the risk of a sharp short-covering bounce. In a trend with ADX near 40 this tends to be a rally within the downtrend rather than a reversal.
CHART PATTERNS
- Descending Triangle / range breakdown: Price consolidated from roughly Aug to late Sep between about $55 and $65. It broke down in early October, and the measured move points lower. The pattern's bearish target is well below the current price.
- Bear Flag / Bearish Pennant: The Oct 26 to 30 bounce to about $43 was a small flag that failed. It resolved lower, and the Nov 5 drop to $30.20 is the breakdown leg.
- Overall structure: A lower-highs, lower-lows downtrend from the roughly $130 peak, a continuation structure. No reversal pattern (double bottom, inverse H&S, falling wedge) has formed. Price needs to reclaim $36 to $41 to challenge the bearish read.
POTENTIAL SCENARIOS
- Scenario 1: Bearish Trend Continuation — Sellers stay in control (−DI far above +DI, CMF deeply negative) and the lower Bollinger Band walk continues. Rallies fade at the falling 21 EMA or the $36 to $37 supply area. Trigger: daily close below $30.20. Target: $26.00 to $28.50, with an extension toward the $27 chart low and below. Invalidation: daily close above $37.15 with RSI back above 45. (55% probability)
- Scenario 2: Bullish Oversold Relief Bounce — RSI at 30 with a hammer-like bounce off $30.20 triggers short covering and a mean-reversion rally toward the mid-band. Trigger: close above $36.33 on rising volume with the MACD histogram turning up. Target: $40 to $41.50 (21 EMA). Invalidation: failure at $41.50, or a close below $30.20. (28% probability)
- Scenario 3: Neutral Basing Range — Price stabilizes after capitulation and chops between $29 and $37 as ADX cools from its extreme. Trigger: several closes between $30 and $36 with ADX rolling over. Target: $31 to $35. Invalidation: a break of either range boundary. (17% probability)
PRICE TARGETS
- Target Price: $28.50 (34-day horizon, about -11.8%)
- Expected Range: $26.00 to $32.00 (width $6.00, about 18.6% of the current price, consistent with the 30-60 day guidance, upper end)
- Key Levels: Support at $30.20 (Nov 5 closing low; the intraday chart low near $27 is the next layer), Resistance at $36.33 (Nov 2 close and prior breakdown area, ahead of the $41.50 21 EMA)
OVERALL BIAS
OVERALL BIAS: BEARISH - Price is in a strong, confirmed downtrend (ADX 39.4 with −DI at 39.2 vs +DI at 10.0), below all key moving averages, with persistent distribution (CMF -0.217) and a bearish MACD cross. Oversold RSI makes sharp bounces likely, but without a reversal pattern or divergence the path of least resistance remains lower.
This is educational analysis and not financial advice.