INTC 34-day bearish forecast — Nov 8, 2026
- Bias: Bearish
- Timeframe: 34 days (made Nov 8, 2026, target date Dec 11, 2026)
- Price at analysis: $56.28
- Price target: $53.00
- Expected range: $48.50 – $58.50
- Result: Pending — graded after the close on Dec 11, 2026
Get a free AI analysis of INTC today
Analysis
TECHNICAL INDICATORS
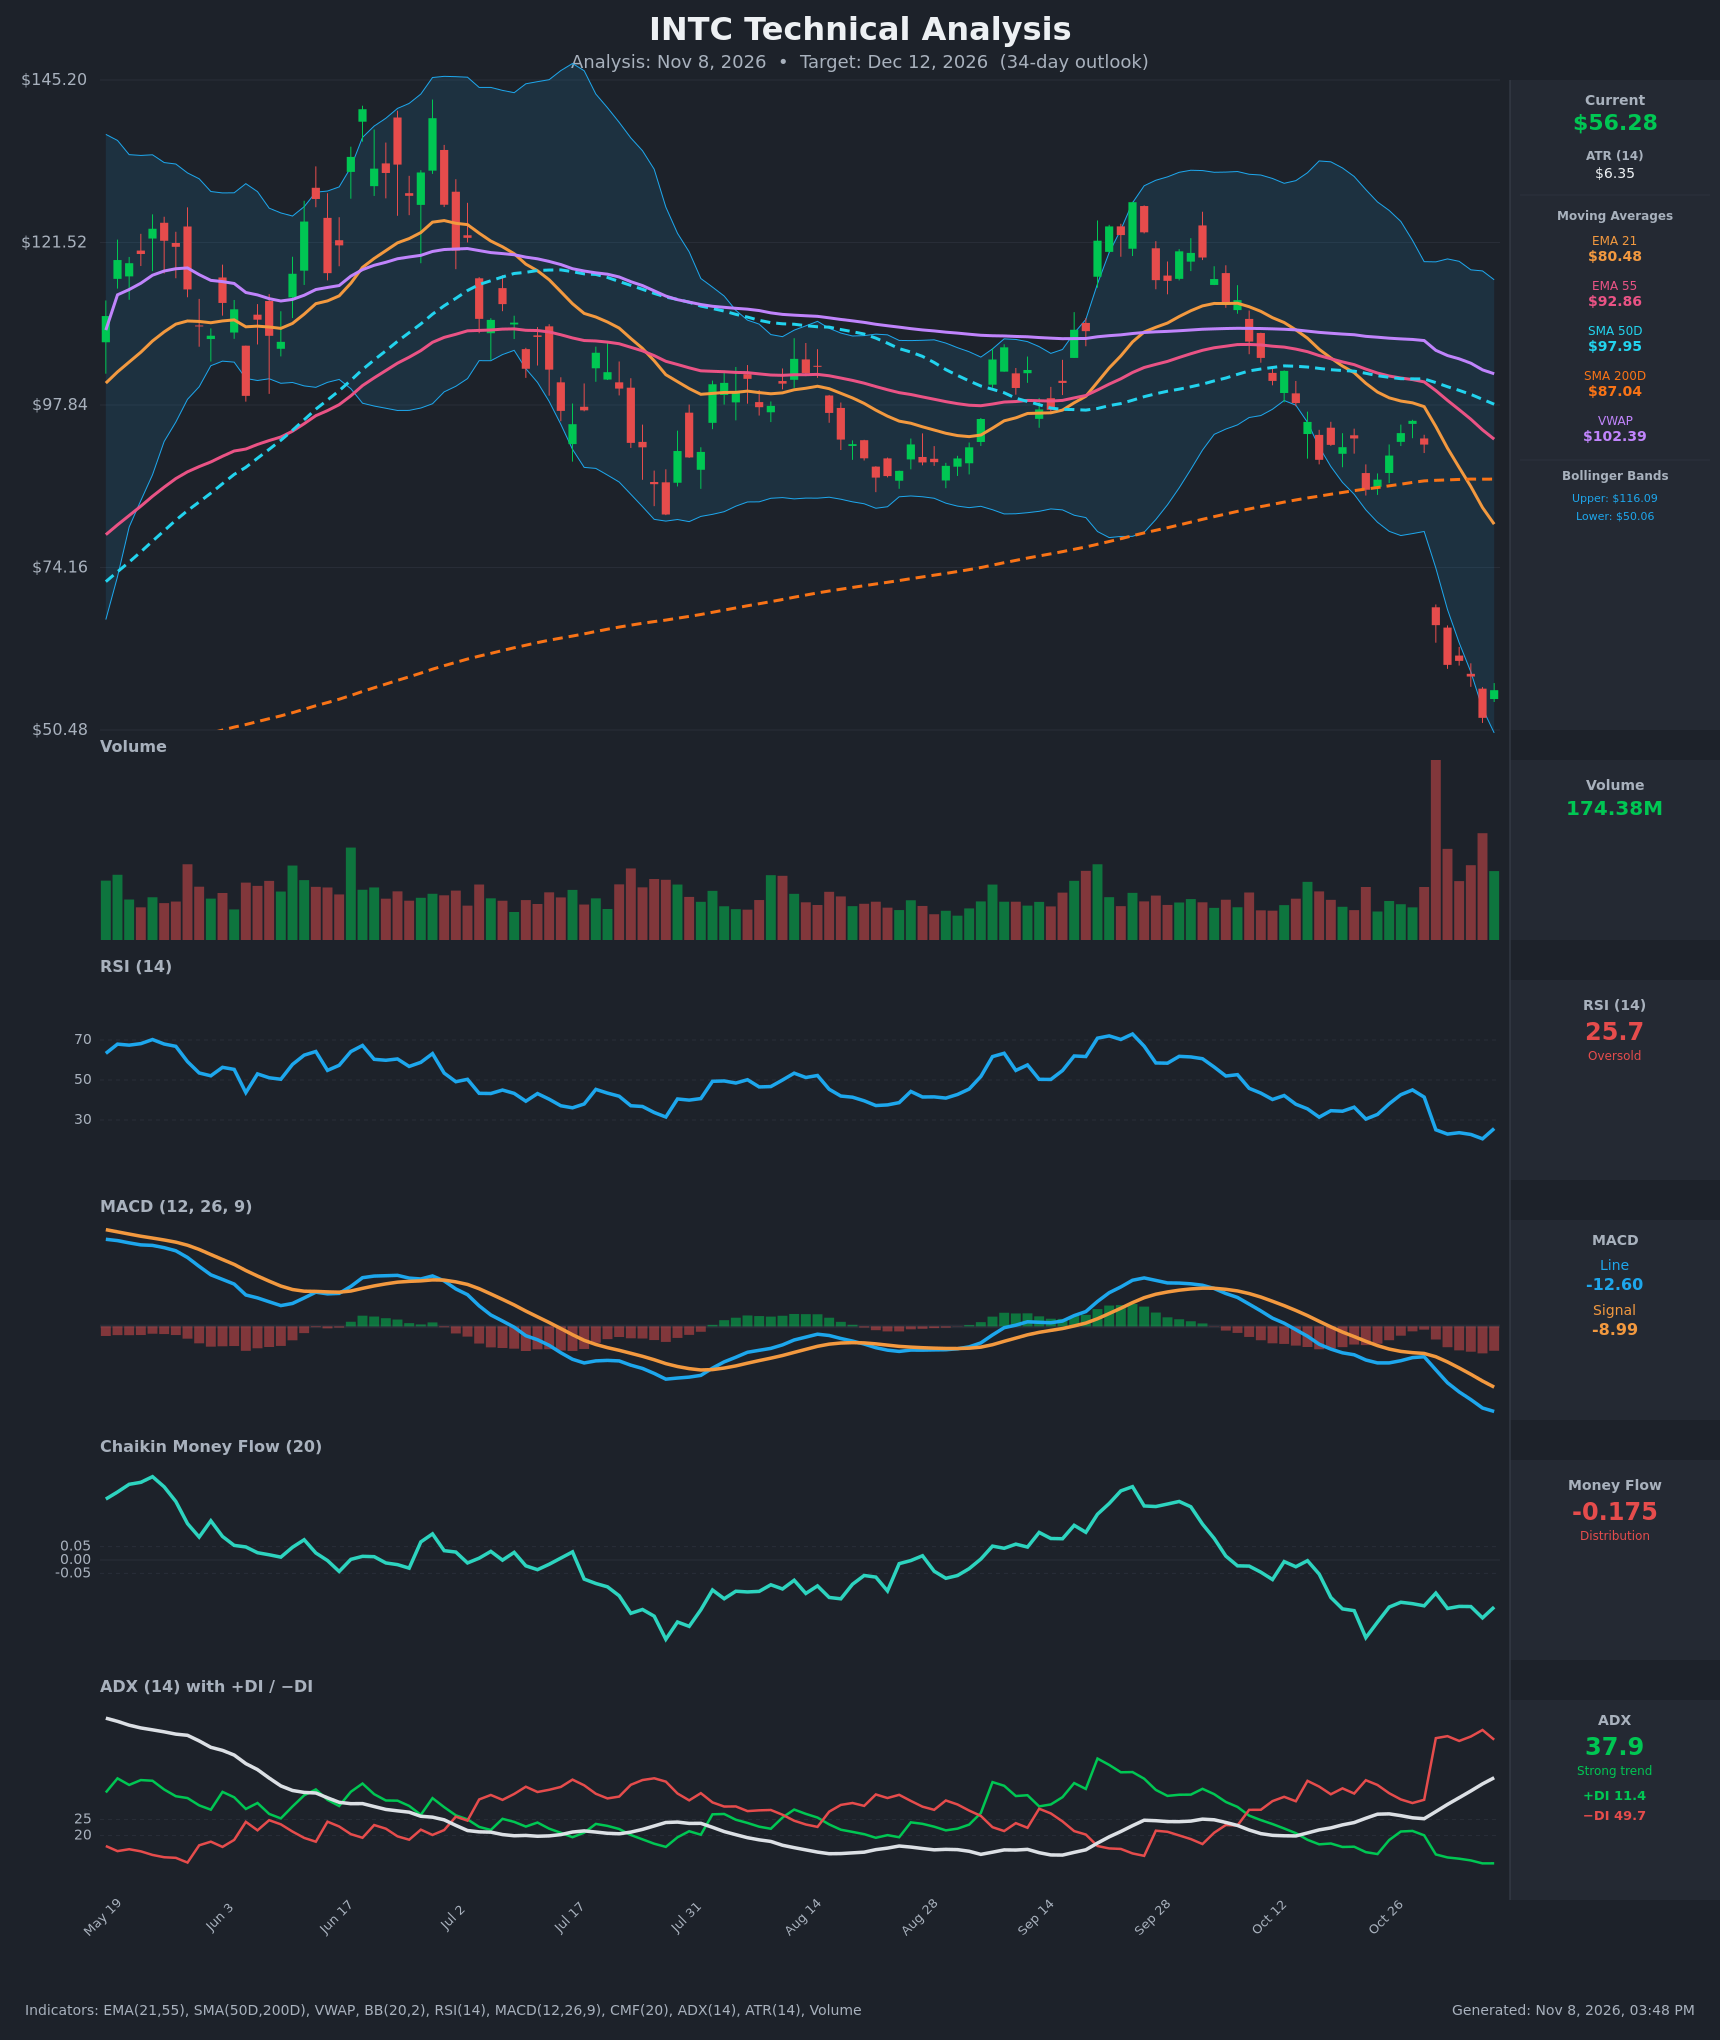
- RSI (14): 25.72, oversold. It hit 20.6 on Nov 5 and ticked up to 25.7 on the Nov 6 bounce. It has fallen from 45 on Oct 28 to the low 20s in about a week. The bounce is early and unconfirmed. [Bearish]
- 20 EMA (EMA 21): $80.48. Price at $56.28 is about 30% below it, and the EMA is falling steeply (from $104.69 on Oct 19). It acts as heavy overhead resistance. [Bearish]
- MACD: Line -12.60 is below the signal at -8.99, and the gap is widening. The bearish crossover happened in late October, and the histogram is increasingly negative. There is no sign of a turn yet. [Bearish]
- Bollinger Bands (20): Upper $116.09, lower $50.06. The bands are very wide after the 29% Oct 30 gap down. Price is in the lower band, just above the $50.06 floor, after tagging or piercing it on Nov 5 ($52.25). This is an extended, oversold reading that raises the odds of a relief bounce. A "walk" down the lower band would mean continuation. [Neutral]
- CMF (20): -0.175, well below -0.05. It has been persistently negative, from -0.12 to -0.29 over the last 15 bars. This shows sustained distribution. [Distribution]
- ADX (14): 37.9 and rising (from 22 on Oct 19), with −DI at 49.7 far above +DI at 11.4. This is a strong, established downtrend with bears firmly in control. [Strong Trend – Bearish]
- Volume: 174.38M on the latest bar. The Oct 30 crash bar had the highest volume on the chart, and volume has stayed elevated since, which points to capitulation and heavy distribution. The latest green bar on solid volume hints at a bounce attempt, but it is not yet a reversal signal. [Bearish with early capitulation signs]
DIVERGENCES & TRENDS
- There is no bullish RSI or MACD divergence. RSI made a lower low (20.6) along with price (about $52), so momentum confirms the decline.
- The moving averages are rolling over. EMA21 crossed below EMA55 around Oct 20 and the gap is widening ($80.48 vs $92.86). SMA50D ($97.95) is still above SMA200D ($87.04), so there is no death cross yet, but SMA50D is falling toward SMA200D and one is likely within weeks.
- Price at $56.28 is far below SMA200D ($87.04), a confirmed long-term downtrend. It is also well below VWAP ($102.39), which signals aggressive selling pressure.
- The ADX is rising with −DI dominant, and CMF has been negative since mid-October. All trend gauges point down.
- Offsetting this, RSI has bounced from 20.6 to 25.7 and the last candle is green. Price is stretched about 30% below EMA21, so a mean-reversion bounce is plausible.
CHART PATTERNS
- There is no clean reversal pattern. The main feature is a breakdown gap (-29% on Oct 30) after a prior rising trend line and a failed rebound (Oct 26–28), which resembles a bearish continuation. Closes since the gap show lower lows ($59.97 → $58.27 → $52.25).
- The small consolidation between $52 and $60 resembles a Bearish Pennant/Flag. A break below $52 would project a measured move toward the low $40s, but that is beyond the 34-day base case. A hold above $50 with a reclaim of $60.55 would instead suggest a basing or Bullish Falling Wedge-type bounce.
- Overhead gap-fill zones sit at $65.76 (the Oct 30 close) and then $80+, so rallies face heavy supply.
POTENTIAL SCENARIOS
- Scenario 1: Bearish Trend Continuation — The ADX trend, −DI dominance, negative CMF and the widening MACD gap favor further drift lower or a failed bounce, with price retesting and probing the lower Bollinger Band. Trigger: Rejection near $60 or a close below $52.25. Target: $50 to $53, with an extension toward $48. Invalidation: Daily close above $60.55 with CMF rising back above -0.05. (45% probability)
- Scenario 2: Bullish Oversold Relief Bounce — RSI is deeply oversold, price is at the lower band, and capitulation volume has been heavy. A mean-reversion rally fills part of the gap. Trigger: Reclaim of $60.55. Target: $65.76 (the Oct 30 close), possibly $68 to $70 near the falling EMA21 zone. Invalidation: Close below $50. (40% probability)
- Scenario 3: Neutral Base Building — Price chops between roughly $50 and $60 as volatility compresses. Trigger: Several closes between $52 and $60 with ADX rolling over. Target: $54 to $58. Invalidation: Break of $50 or $60.55 on volume. (15% probability)
PRICE TARGETS
34-day timeframe (range width: $58.50 − $48.50 = $10.00, about 17.8% of the current price, in line with the 12–18% guidance for 30–60 days).
- Target Price: $53.00
- Expected Range: $48.50 to $58.50
- Key Levels: Support at $50.00, Resistance at $60.50
OVERALL BIAS
OVERALL BIAS: BEARISH - ADX at 37.9 with −DI far above +DI, a widening bearish MACD, persistent distribution on CMF, and price far below all key moving averages outweigh the oversold RSI. Bounces are likely to meet heavy resistance near $60 to $66. Oversold conditions mean the move lower may be choppy and a relief rally is a significant risk.
This is educational analysis and not financial advice.