META 34-day bearish forecast — Nov 8, 2026
- Bias: Bearish
- Timeframe: 34 days (made Nov 8, 2026, target date Dec 11, 2026)
- Price at analysis: $610.15
- Price target: $580.00
- Expected range: $530.00 – $625.00
- Result: Pending — graded after the close on Dec 11, 2026
Get a free AI analysis of META today
Analysis
TECHNICAL INDICATORS
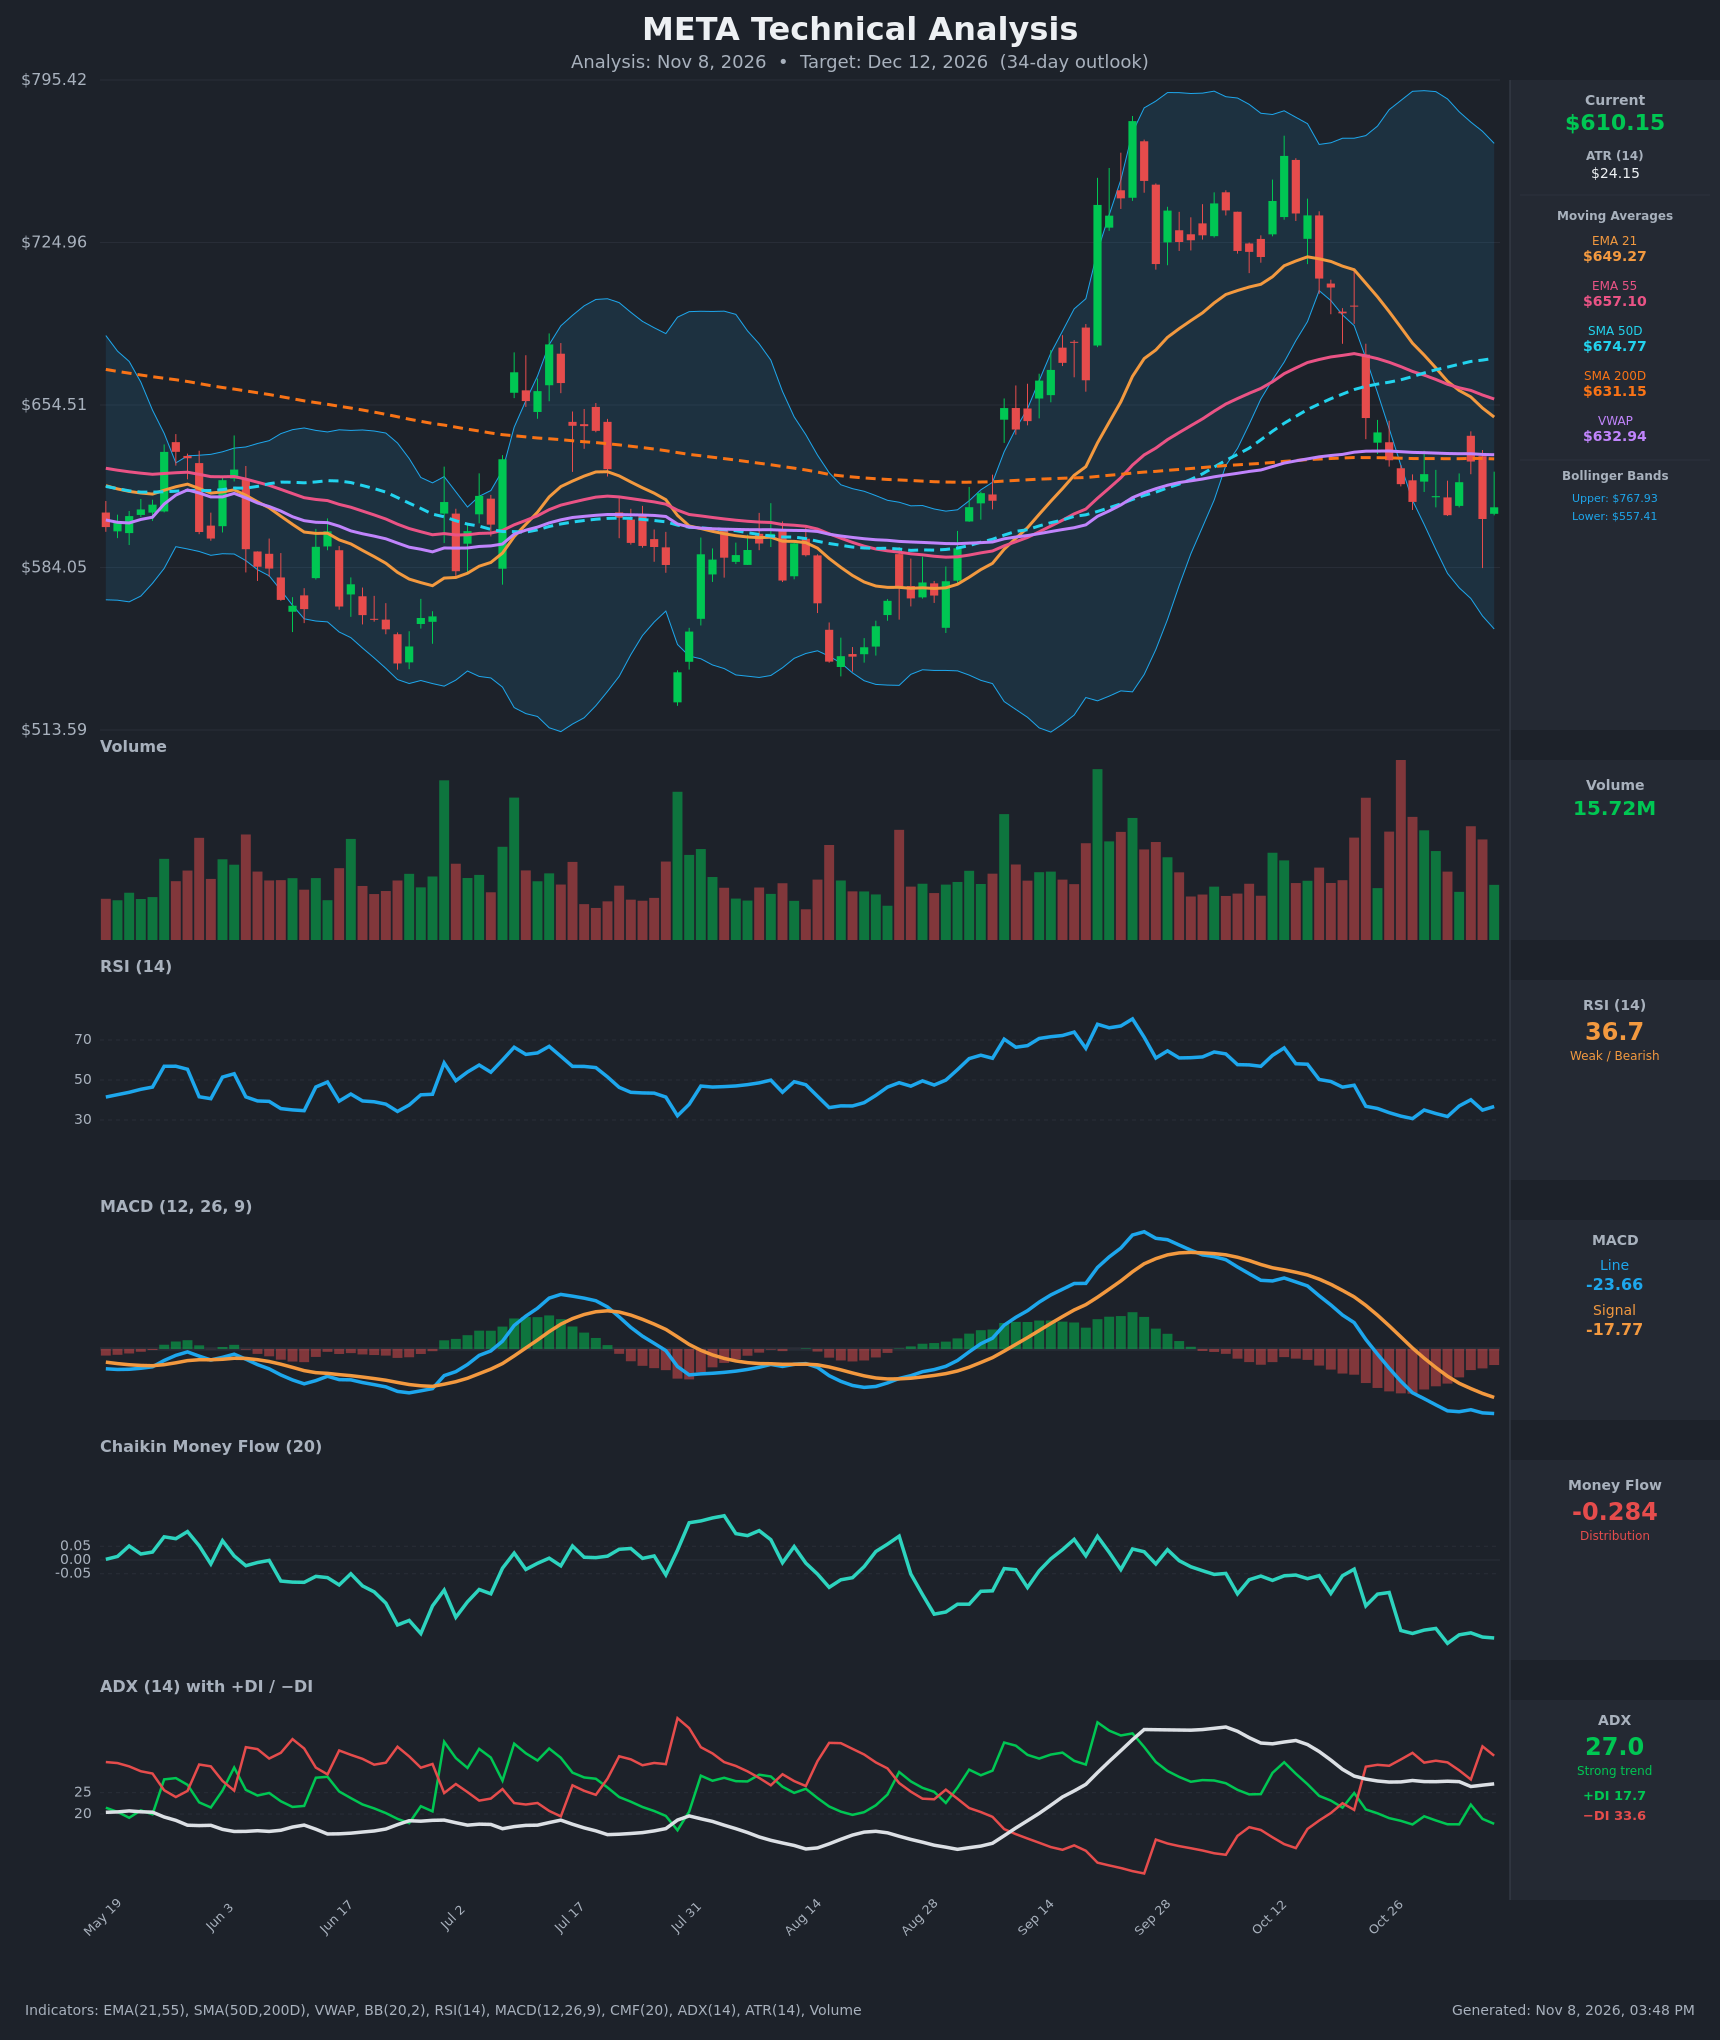
- RSI (14): 36.74. It is weak and sits below 50, but not oversold (<30). It bottomed near 30.7 on Oct 28 and has since chopped between 31 and 40. Momentum is bearish with a slight stabilization. [Bearish]
- 20 EMA (EMA 21 = $649.27): Price at $610.15 is about 6% below the EMA 21, which is falling steeply from $716 in mid-October. It acts as dynamic resistance. EMA 21 ($649.27) is also below EMA 55 ($657.10), a bearish cross that occurred around Nov 3. [Bearish]
- MACD: Line at -23.66, signal at -17.77, so the line is below the signal with a negative histogram of about -5.9. The bearish crossover happened around Oct 28-29, and the line is still making new lows. Momentum is bearish and only gradually decelerating. [Bearish]
- Bollinger Bands (20): Upper $767.93, lower $557.41, mid about $662.67. Price is in the lower half, about 25% of the band width above the lower band, with the bands still wide after the September surge. There is no squeeze, and price is below the midline with room to test the lower band. [Bearish]
- CMF (20): -0.284, deep in distribution (below -0.05) and near the lowest reading on the chart. It has been persistently negative for weeks, which shows sustained selling pressure. [Distribution]
- ADX (14): 27.0 with -DI 33.6 over +DI 17.7. The trend is strong and the bears are firmly in control. ADX is flat to slightly above 25, so the downtrend is established. [Strong Trend - Bearish]
- Volume: 15.72M, moderate and not a capitulation spike. Earlier heavy red bars at the Oct 22 gap-down show institutional distribution. The recent bounces came on light volume, which confirms weak buying interest. [Bearish-leaning]
DIVERGENCES & TRENDS
- No clear bullish divergence: RSI made a higher low (about 33 on Nov 5 vs 30.7 on Oct 28) while price made a lower low ($605.08 vs $606.73 on Nov 2). That is only a minor, unconfirmed hint of divergence. MACD and CMF are both making new lows, which confirms the price weakness.
- Moving averages: EMA 21 has crossed below EMA 55 (bearish). SMA50D ($674.77) is still above SMA200D ($631.15), so there is no death cross yet. The SMA50D is flattening and the gap to the SMA200D is narrowing in a way that could set up a future death cross if weakness persists.
- Price vs. long-term support: Price is below the SMA200D ($631.15), VWAP ($632.94), EMA 21 and EMA 55, so every key average is overhead resistance. The SMA200D has flipped from support to resistance.
- DI/ADX: -DI crossed above +DI on Oct 22 and has stayed there. ADX is holding above 25 with -DI dominant.
- Price structure: A lower high sequence ($730 to $705 to $630) with a sharp gap-down on Oct 22 confirms a developing downtrend after the September spike.
CHART PATTERNS
- Bearish Head and Shoulders / lower-high structure (loosely): The September-October rally topped around $740, followed by a lower high near $705 and now a breakdown below the $631 SMA200D. This resembles a broad distribution top, with the neckline near $605-$630 as the immediate test. A confirmed break below $600 projects toward about $540-$560.
- Bearish Flag/Pennant (small scale): The tight consolidation between $605 and $630 over the last 8 sessions after the sharp drop is a bearish continuation setup. A breakdown below $605 targets the measured move toward the $557 lower Bollinger Band and the $540s.
- Support zone: The range lows from July-August near $540-$585 are the next major demand area.
POTENTIAL SCENARIOS
- Scenario 1: Bearish Continuation Breakdown — Price breaks the $605 consolidation low, with all moving averages overhead and CMF/ADX confirming selling. Trigger: daily close below $603 on rising volume. Target: $557 first, then $535-$545 (2.2x ATR extensions over 34 days). Invalidation: daily close above $650 (EMA 21 reclaim). (55% probability)
- Scenario 2: Neutral Range-Bound Basing — Price holds the $585-$630 zone as RSI stays near 30-40 and sellers exhaust. Trigger: failed breakdown below $600 with a reversal candle. Target: $590-$635 range chop. Invalidation: close below $580 or above $650. (15% probability)
- Scenario 3: Bullish Oversold Relief Rally — A mean-reversion bounce toward the falling averages after CMF and RSI reach extremes. Trigger: close above $632 (SMA200D/VWAP) with volume expansion. Target: $650-$660 (EMA 21/55 cluster), possibly the $675 SMA50D. Invalidation: rejection at $650 and a close back below $610. (30% probability)
PRICE TARGETS
For the 34-day timeframe, the width formula (30-60 days → 12-18%) gives a range of about $73-$110 on a $610.15 price.
- Target Price: $580.00 (34 days, Dec 12, 2026)
- Expected Range: $530.00 to $625.00 (width $95, about 15.6% of current price, consistent with the 30-60 day guidance)
- Key Levels: Support at $557.41 (lower Bollinger Band), Resistance at $631.15 (SMA200D)
OVERALL BIAS
OVERALL BIAS: BEARISH - Price is below every key moving average, with an EMA 21/55 bearish cross, a negative MACD below its signal, -DI dominating with ADX above 25, and deeply negative CMF (-0.284) showing persistent distribution. Relief bounces are likely to meet resistance at $631-$650, which favors a drift toward the $557 band and the low $500s-$580s zone.
This is educational analysis and not financial advice.