USO 34-day bearish forecast — Nov 8, 2026
- Bias: Bearish
- Timeframe: 34 days (made Nov 8, 2026, target date Dec 11, 2026)
- Price at analysis: $148.41
- Price target: $143.50
- Expected range: $130.50 – $157.00
- Result: Pending — graded after the close on Dec 11, 2026
Get a free AI analysis of USO today
Analysis
TECHNICAL INDICATORS
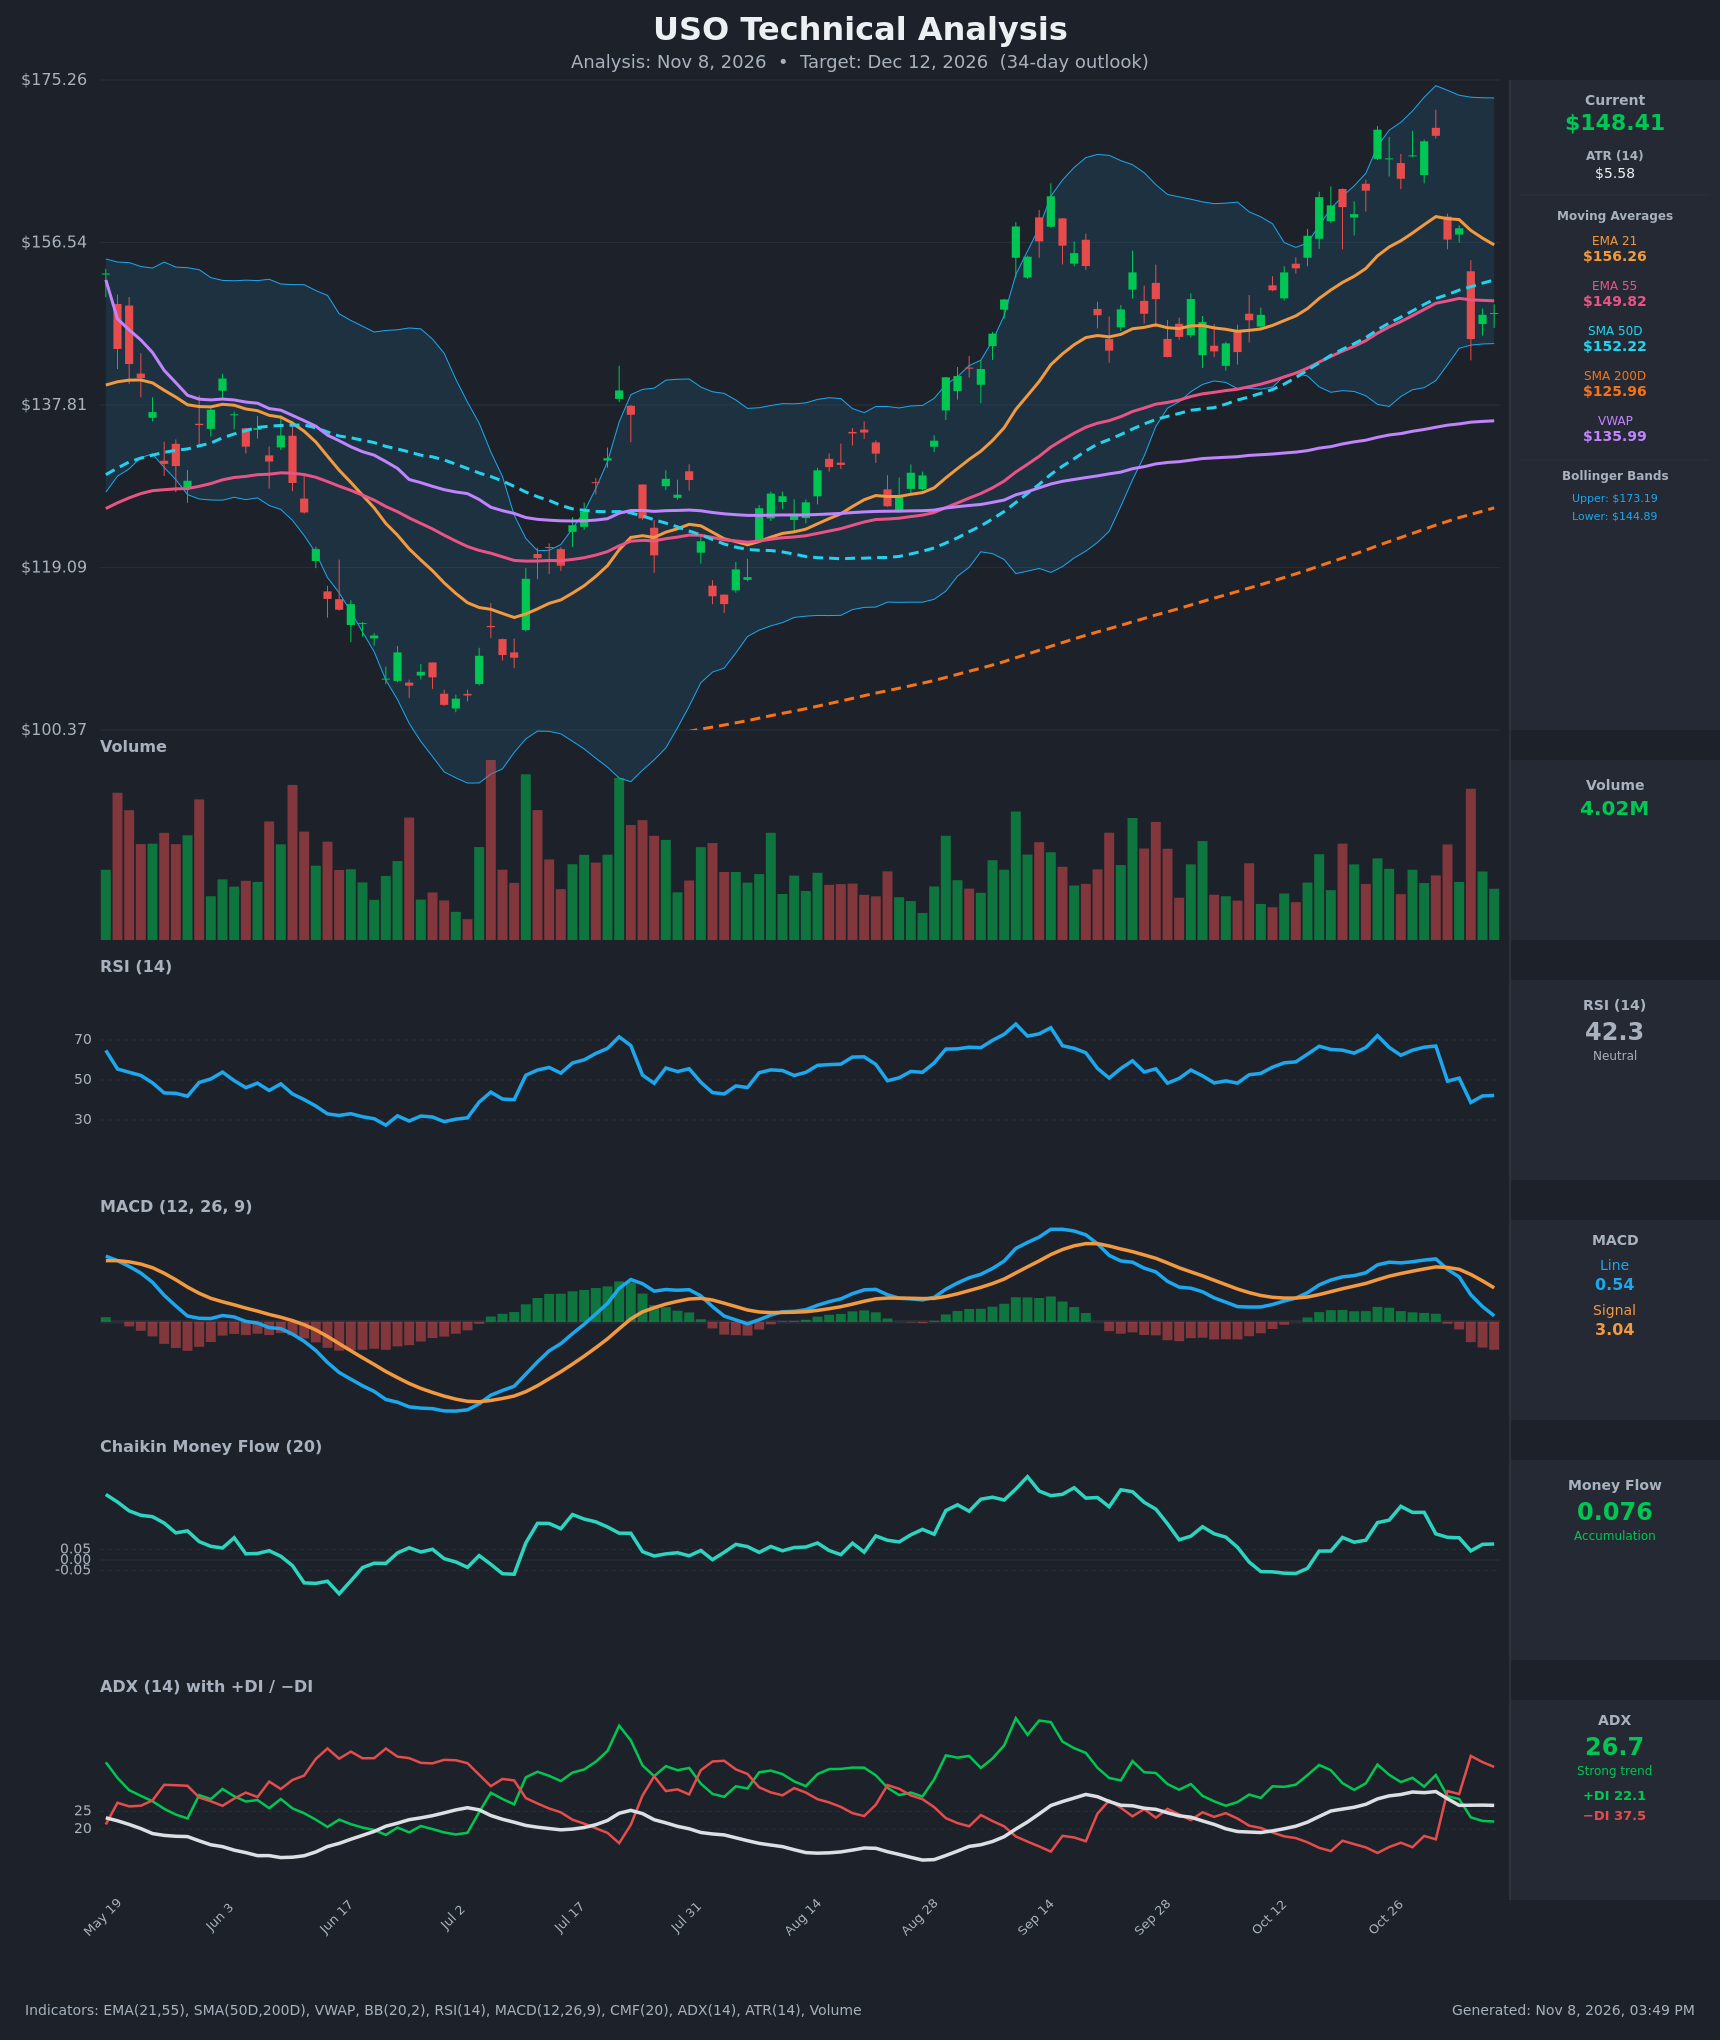
- RSI (14): 42.27, down from the mid-60s in late October. It fell sharply after the Oct 30 peak (67.0) and bottomed near 38.8 on Nov 4. It has bounced only slightly and sits below the 50 midline, so momentum is weakening but not oversold. [Bearish]
- 20 EMA: The 21 EMA is $156.26 and falling for the last 6 sessions. Price at $148.41 is about 5% below it, so it acts as overhead resistance. [Bearish]
- MACD: The MACD line (0.536) crossed below the signal (3.044) on Nov 2 and the gap has widened. The histogram is deeply negative and the line is nearing zero. Momentum is clearly rolling over. [Bearish]
- Bollinger Bands (20): Upper $173.19, lower $144.89. Price at $148.41 is in the lower quarter of the bands, about $3.5 above the lower band. The bands are still wide after the October rally. A walk down the lower band is possible, but the squeeze from the Nov 4 gap-down is not yet resolved. [Neutral]
- CMF (20): 0.076, above the +0.05 threshold, but it has fallen from 0.256 on Oct 27. Buying pressure is fading although still mildly positive. [Accumulation]
- ADX (14): 26.7, a strong trend. −DI (37.5) is well above +DI (22.1) after the bearish DI crossover on Nov 2. The trend is currently down. [Strong Trend – Bearish]
- Volume: 4.02M, average. The Nov 4 breakdown candle (−8%) came on a spike in selling volume, and the rebound since has been on lighter volume. This suggests a weak bounce within a corrective move. [Bearish]
DIVERGENCES & TRENDS
- There is no clear divergence. RSI and MACD both confirm the price decline from the $169 high.
- The bearish MACD signal-line crossover (Nov 2) and the bearish DI crossover (−DI over +DI) are fresh and confirm each other.
- The Oct 30 to Nov 4 drop of about 14% broke below the 21 EMA and the Oct consolidation, and price now sits just under the 55 EMA ($149.82). Price is below the 50D SMA ($152.22), which is now rising and about to be tested as resistance.
- The longer-term trend is still up. The 50D SMA is well above the 200D SMA ($125.96), so the golden cross is long established, and price is far above the 200D SMA and VWAP ($135.99). That makes this look like a pullback inside a larger uptrend rather than a full reversal.
- The EMA21 (156.26) is still above the EMA55 (149.82) but the gap is narrowing quickly, so a bearish EMA cross is approaching.
- CMF remaining slightly positive is the main counter-signal.
CHART PATTERNS
- The recent price action resembles a Bearish Double Top. Peaks at about $169.5 (Oct 23) and $168.8 (Oct 30) were followed by a sharp breakdown on Nov 4. The neckline near $156–158 was broken on high volume. A measured move from a ~$169 peak and a ~$157 neckline (about $12) points to roughly $145. Price is already near this, so extension to the $138–142 zone (the old range top and Sept consolidation) is plausible.
- The Aug–Oct consolidation base is around $138–$145. The major support zone is $138–$144, where the lower Bollinger Band and prior congestion sit.
- Because the larger trend remains up (above the rising 200D SMA), a deeper retracement into the rising 50D/55 EMA zone and the $138–$142 area would be a normal correction.
POTENTIAL SCENARIOS
- Scenario 1: Bearish Double-Top Follow-Through — The Nov 4 breakdown extends as price fails at the 55 EMA and 50D SMA and fills toward the prior consolidation. Trigger: close below $144.40 (recent low and lower band). Target: $136–$140. Invalidation: daily close above $157 (reclaims the 21 EMA). (50% probability)
- Scenario 2: Neutral Choppy Consolidation — Price holds the $142–$156 band, with the lower Bollinger Band and 55 EMA acting as a floor and the 21 EMA as a cap. Trigger: failure to close below $144 and repeated rejections near $154–$156. Target: $146–$152. Invalidation: a close outside $141–$157. (28% probability)
- Scenario 3: Bullish Recovery to Uptrend — Positive CMF and the long-term uptrend support a dip-buy that reclaims the EMAs. Trigger: close above $156.50 with MACD turning up. Target: $162–$168. Invalidation: close below $143. (22% probability)
PRICE TARGETS
- Target Price: $143.50 (34 days)
- Expected Range: $130.50 to $157.00. Width is $26.50, about 17.9% of the current price, which fits the 30-60 day guidance.
- Key Levels: Support at $144.00 (recent low and lower Bollinger Band), with the next support at $138.00. Resistance at $152.22 (50D SMA), then $156.26 (21 EMA).
OVERALL BIAS
OVERALL BIAS: BEARISH - A bearish MACD cross, −DI dominance with ADX above 25, price below the 21 EMA and 50D SMA, and a double-top breakdown favor a further pullback toward the $138–$144 support zone. The long-term uptrend and positive CMF limit the downside.
This is educational analysis and not financial advice.