USO 55-day bearish forecast — Nov 8, 2026
- Bias: Bearish
- Timeframe: 55 days (made Nov 8, 2026, target date Jan 1, 2027)
- Price at analysis: $148.41
- Price target: $140.00
- Expected range: $130.00 – $153.50
- Result: Pending — graded after the close on Jan 1, 2027
Get a free AI analysis of USO today
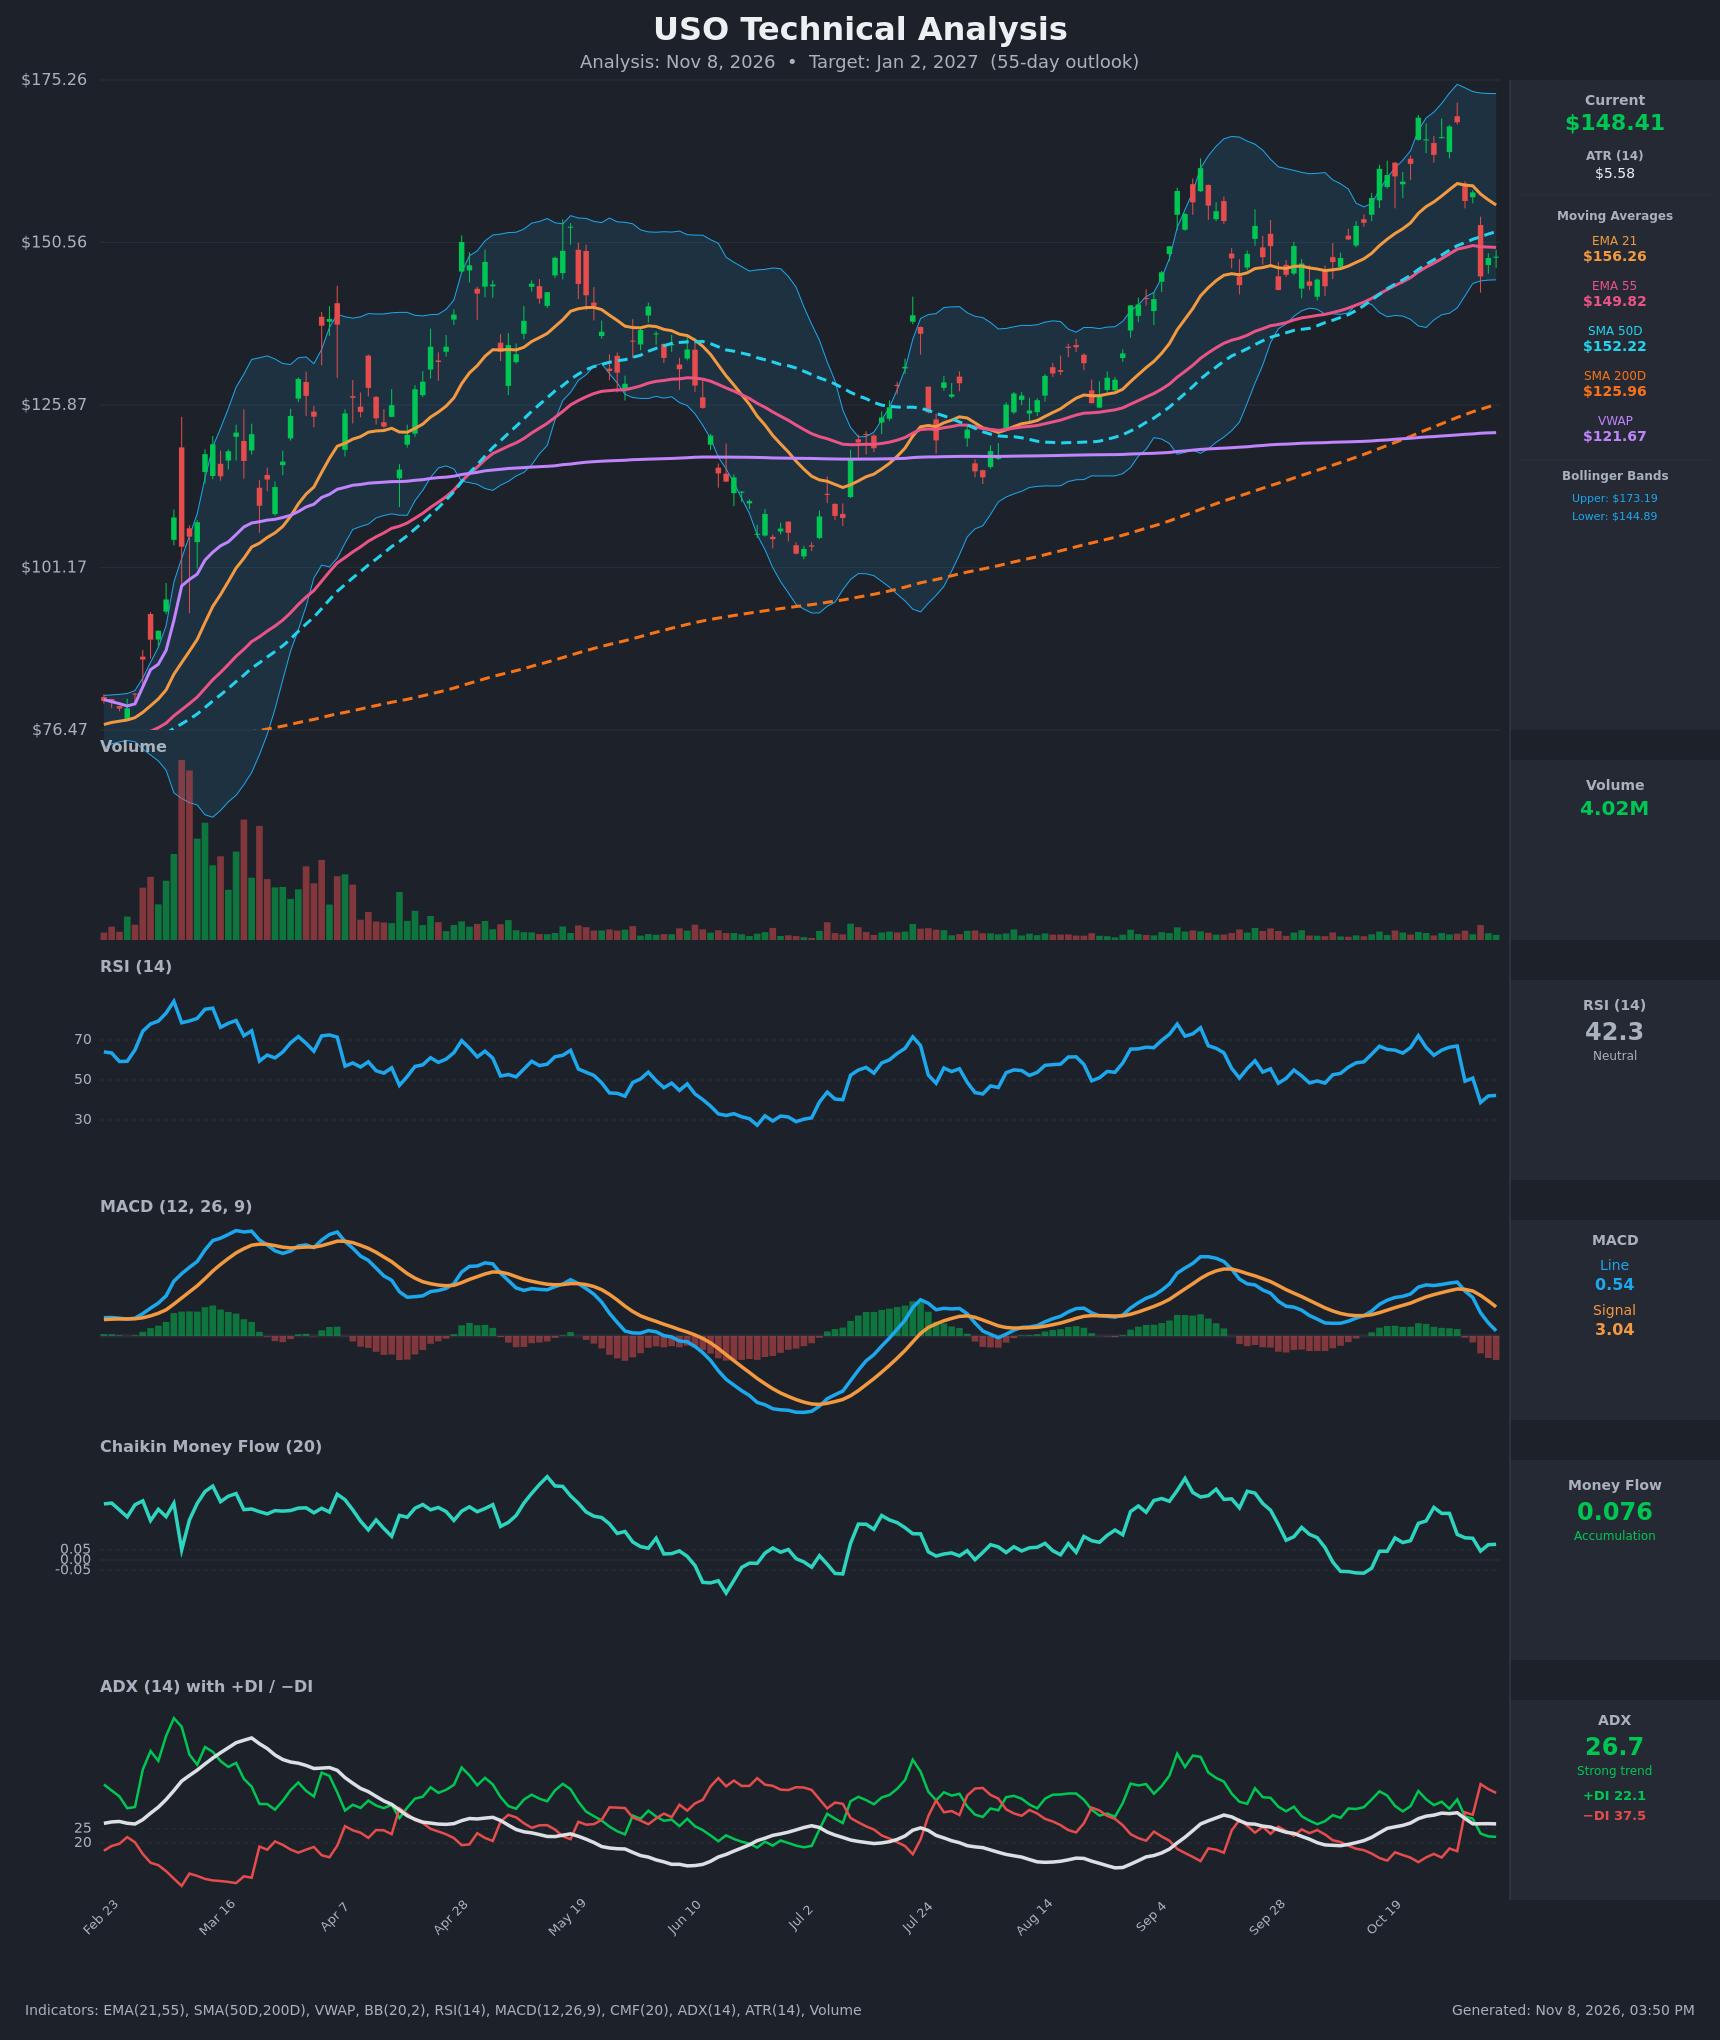
Analysis
TECHNICAL INDICATORS
- RSI (14): 42.27, down sharply from 67 on Oct 30 and a low of 38.8 on Nov 4. It is now below the 50 midline with only a small bounce, so momentum is bearish but not oversold. [Bearish]
- 20 EMA (EMA 21 = $156.26): Price at $148.41 is about 5% below it, and the EMA is rolling over from its $159.52 peak. It now acts as overhead resistance. EMA 55 ($149.82) has also been lost by a small margin, and SMA50D ($152.22) is overhead as well. [Bearish]
- MACD: Line 0.54 against signal 3.04. The bearish crossover happened around Nov 2, and the line has since fallen from 5.64 to 0.54. The histogram is negative and widening, so downside momentum is accelerating. [Bearish]
- Bollinger Bands (20): Upper $173.19, lower $144.89, midline about $159. Price is in the lower quarter of the bands after the Nov 4 plunge, just above the lower band. The bands are still wide after the rally. A close below $144.89 would signal a band walk, while a bounce would likely stall at the midline. [Neutral to Bearish]
- CMF (20): 0.076, slightly above the +0.05 threshold but fading from 0.256 on Oct 27. Buying pressure is still marginally present but weakening, and it is the one supportive indicator. [Accumulation]
- ADX (14): 26.7 with −DI at 37.5 well above +DI at 22.1. The DI crossover bearish flip occurred on Nov 2, and the −DI spread has widened sharply. The trend is strong and now directed down. [Strong Trend – Bearish]
- Volume: 4.02M, roughly in line with recent average. The Nov 4 reversal candle (−8%) was a high-volume distribution-style down bar, and there has been no strong buying volume on the bounce. [Mildly Bearish]
DIVERGENCES & TRENDS
- Price vs. RSI/MACD: The Oct 23 high of $169.53 was followed by a marginally lower high on Oct 30 ($168.83). The RSI peak (72 to 67) and MACD peak (5.1 to 5.6) did not confirm this cleanly, and momentum rolled over right after.
- Moving averages: The EMA21 > EMA55 > SMA50D stack is flattening. EMA21 is now falling toward EMA55 and will likely cross below it within days if price stays under $150. This is a bearish near-term crossover in progress.
- SMA crossovers: There is no death cross. SMA50D ($152.22) is well above SMA200D ($125.96), so the long-term uptrend is intact. Price is above SMA200D, but a pullback within an uptrend can extend toward the rising SMA200D.
- VWAP: Price is well above VWAP ($121.67), so the longer-term buyer base is in profit, but this lagging reference offers no near-term support.
- DI crossover: −DI crossed above +DI on Nov 2 and the gap is widening. ADX is above 25, which confirms trend strength.
- CMF: It is trending lower from 0.256, which is an early warning that accumulation is fading.
CHART PATTERNS
- Bearish Double Top: Peaks at $169.53 (Oct 23) and $168.83 (Oct 30). The neckline was broken decisively by the Nov 2–4 decline (about $169 to $145). The measured move from the peak to the neckline (about $9 to $10) projects roughly $150 or lower from the breakdown level, which price has already nearly reached. A bounce or retest of the $152–$156 area is typical before any continuation.
- Possible Bearish Rising Wedge (higher timeframe): The Aug–Oct advance narrowed into a rising channel that has now broken down. Targets for such a wedge typically retrace to the start of the wedge (the $125–$135 zone, near SMA200D and the Aug–Sep consolidation).
- Context: The prior uptrend from the July low ($101) is long and extended, which raises the odds of a deeper correction, but the series of higher lows has not yet been broken.
POTENTIAL SCENARIOS
- Scenario 1: Bearish Continued Pullback to Mid-$130s/$140 — Price retests the $150–$152 resistance cluster (EMA55/SMA50D), fails, and grinds lower as −DI dominates and MACD stays below signal. Trigger: daily close below the Nov 4 low around $142–$145 (lower Bollinger Band). Target: $138–$140, with an extension toward $132. Invalidation: daily close above $156.30 (EMA21) with MACD turning back up. (45% probability)
- Scenario 2: Bearish Deeper Correction Toward SMA200D — A double top and rising wedge failure unwinds the Aug–Oct rally, drawing price toward the Sep consolidation zone and the rising SMA200D. Trigger: breakdown below $140 with expanding volume and CMF turning negative. Target: $126–$132. Invalidation: reclaim of $150 on rising volume. (20% probability)
- Scenario 3: Bullish Recovery and Re-test of Highs — Support holds around $142–$145, CMF stays positive, and price reclaims the moving average cluster, rebuilding the uptrend. Trigger: close above $152.22 (SMA50D), then above $156.30. Target: $160–$165, with a retest of $169 only if momentum clearly returns. Invalidation: close below $142. (35% probability)
PRICE TARGETS
For the 55-day timeframe (to about Jan 2, 2027):
- Target Price: $140.00 (about −5.7% from the current $148.41)
- Expected Range: $130.00 to $153.50 (width $23.50, about 15.8% of current price, consistent with the 12–18% guidance for 30–60 days)
- Key Levels: Support at $141.50 (Nov 4 low area, just below the $144.89 lower Bollinger Band), Resistance at $152.22 (SMA50D, with EMA55 at $149.82 just below it and EMA21 at $156.26 above)
OVERALL BIAS
OVERALL BIAS: BEARISH - Price has broken down from a double top and is below EMA21, EMA55 and SMA50D. MACD is in a bearish crossover with a widening negative histogram, and −DI sits far above +DI with ADX above 25. The still-positive CMF and the intact SMA200D uptrend limit the downside, which is why the target is a moderate pullback to about $140 rather than a collapse.
This is educational analysis and not financial advice.