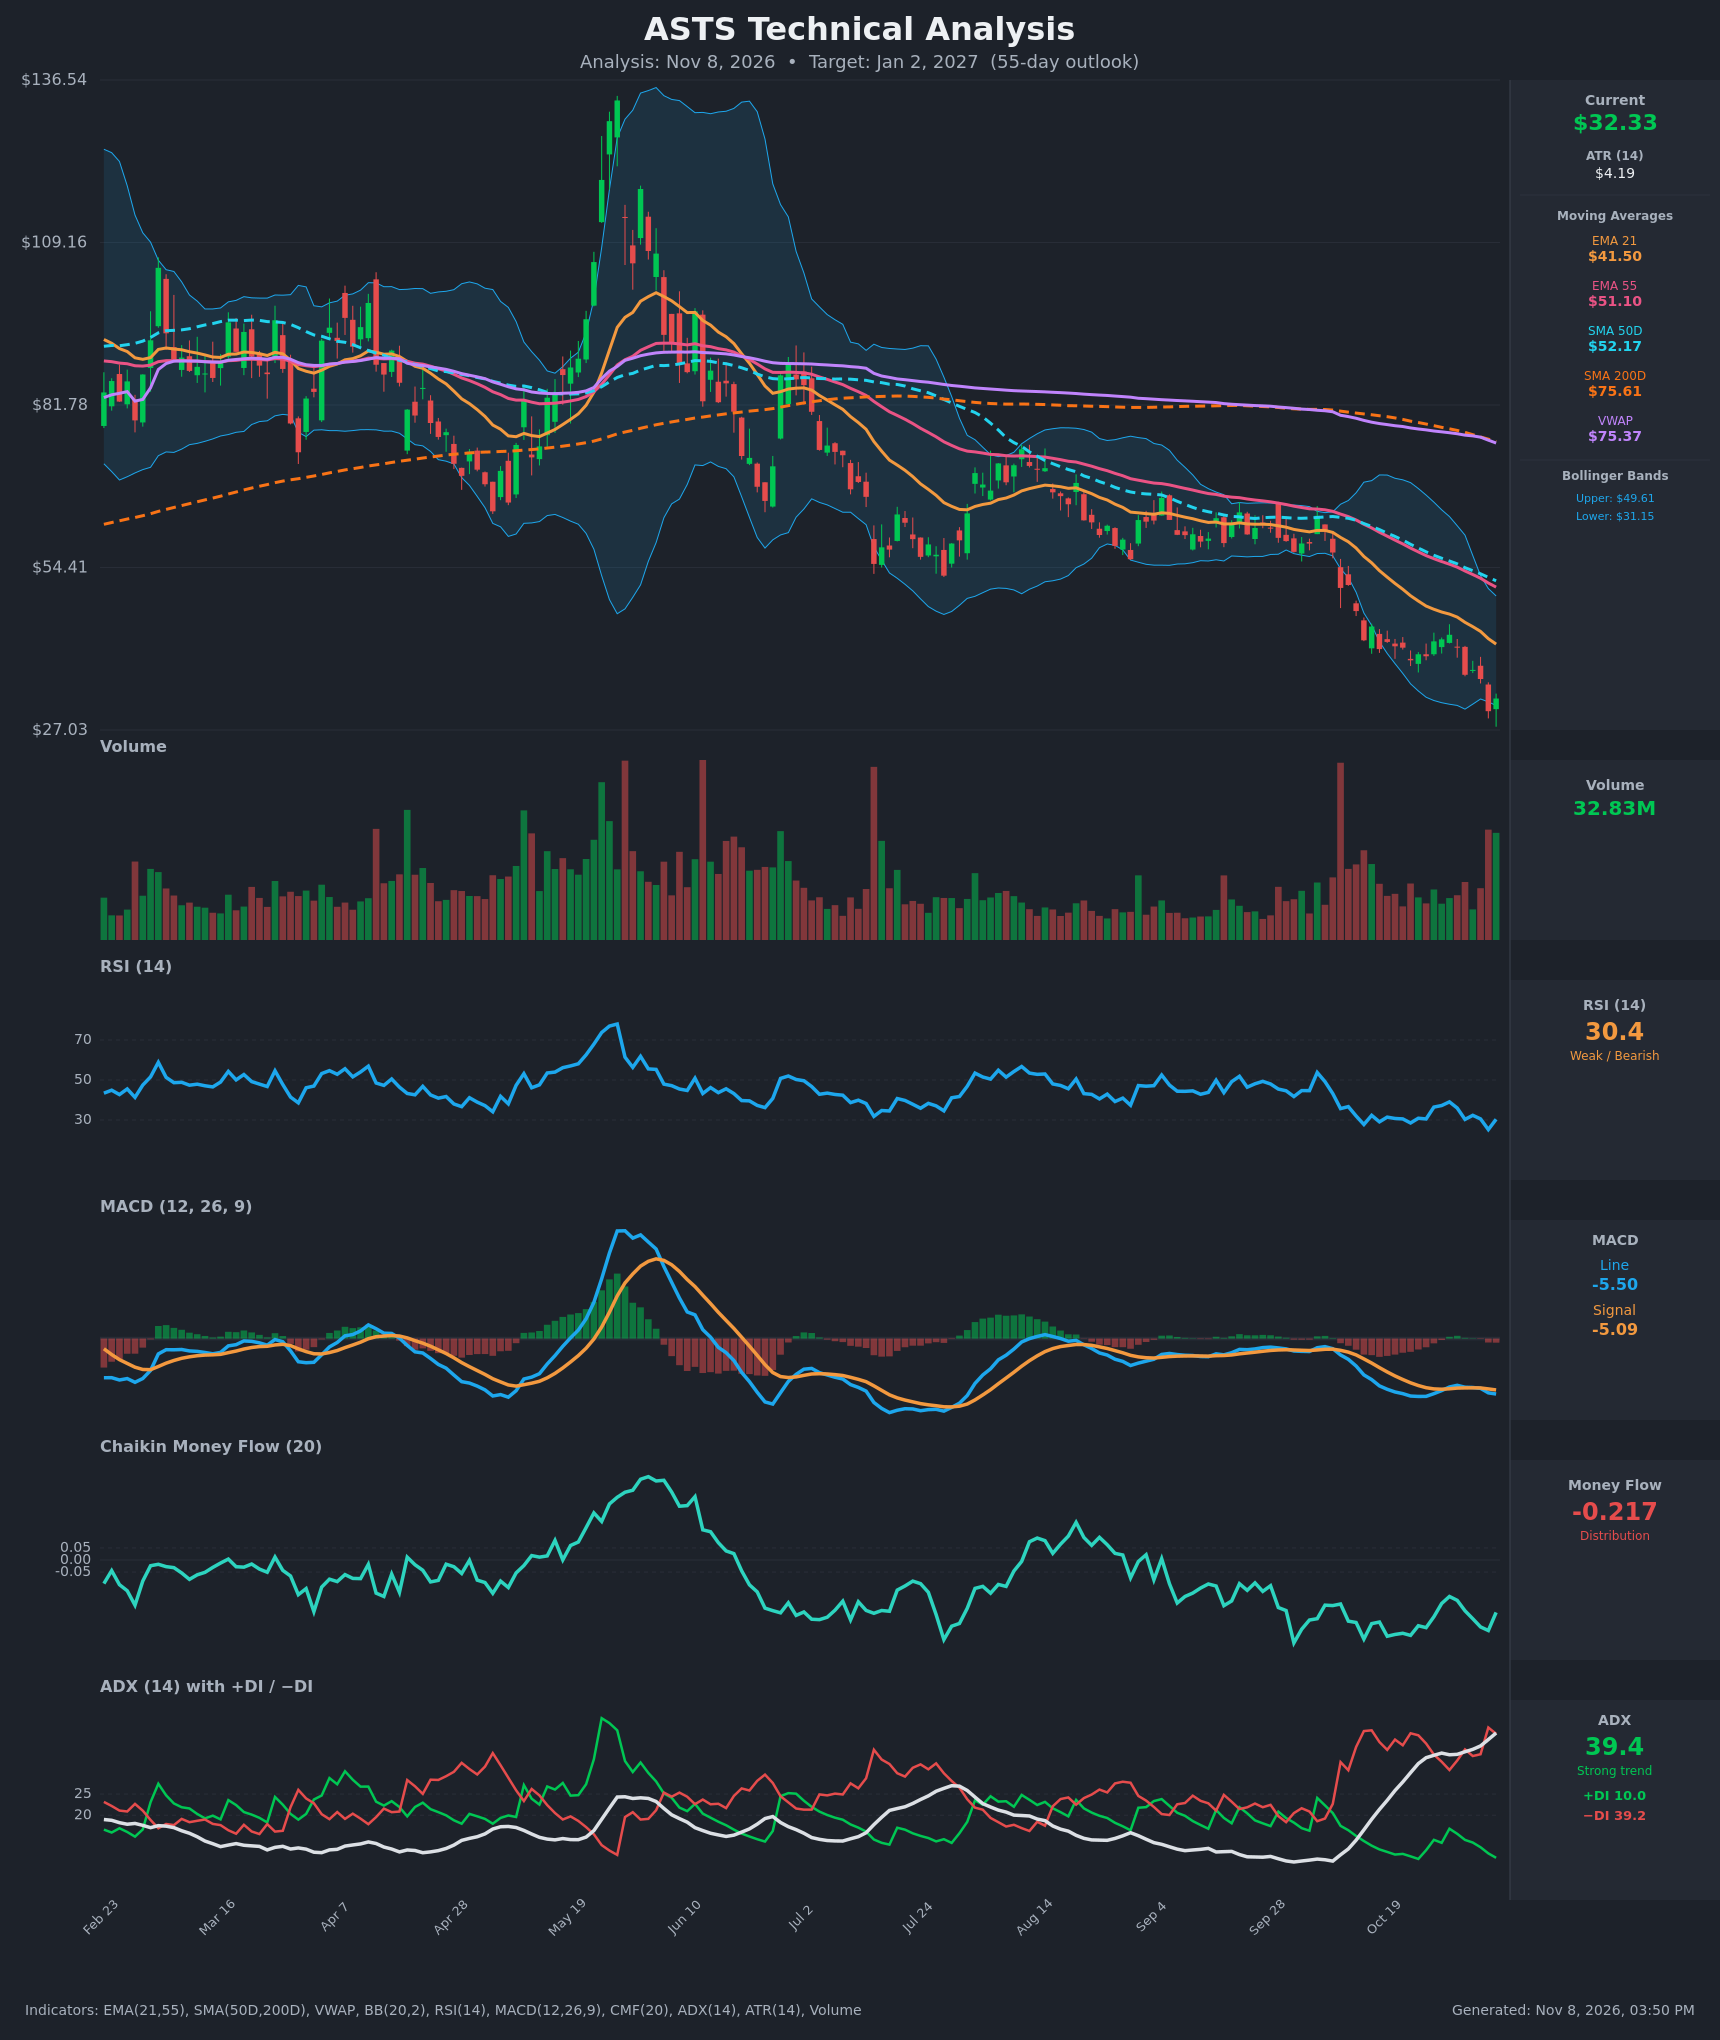
ASTS 55-day bearish forecast — Nov 8, 2026
- Bias: Bearish
- Timeframe: 55 days (made Nov 8, 2026, target date Jan 1, 2027)
- Price at analysis: $32.33
- Price target: $29.00
- Expected range: $21.50 – $39.00
- Result: Pending — graded after the close on Jan 1, 2027
Get a free AI analysis of ASTS today
Analysis
TECHNICAL INDICATORS
- RSI (14): 30.36, sitting at the oversold threshold after bottoming at 25.2 on Nov 5. It has bounced slightly but has stayed in the 25-39 range for about 3 weeks, so momentum is weak and there is no confirmed reversal yet. [Bearish]
- 20 EMA: The 21 EMA is $41.50 and price at $32.33 is about 22% below it. The EMA is falling steeply (from $52.78 to $41.50 in 15 bars) and acts as overhead resistance. [Bearish]
- MACD: Line -5.495 is below signal -5.090, with a negative histogram of about -0.40. The line is rolling over again after a brief narrowing in late October, so bearish momentum is renewing. [Bearish]
- Bollinger Bands (20): Upper $49.61, lower $31.15. Price at $32.33 is hugging the lower band, and the Nov 5 close of $30.20 was below it. This shows a strong downtrend (a "band walk") but also stretched conditions that favor a relief bounce. [Bearish]
- CMF (20): -0.217, well below -0.05, and negative for the entire visible period. It signals persistent distribution, with no accumulation on the bounces. [Distribution]
- ADX (14): 39.4 and rising, with −DI 39.2 far above +DI 10.0. This is a strong, established downtrend with bears firmly in control. +DI is near its lows with no sign of a DI crossover. [Strong Trend - Bearish]
- Volume: 32.83M on the latest bar, among the highest of the recent period, with heavy volume on the Nov 5 selloff. Elevated volume on the breakdown suggests capitulation-like selling, though it has not yet produced a convincing reversal. [Bearish with capitulation risk]
DIVERGENCES & TRENDS
- No bullish RSI divergence is confirmed. RSI made a lower low (25.2 on Nov 5) alongside a lower price low ($30.20), so momentum confirms price.
- The price bounce from $30.20 to $32.33 is small relative to the drop, and the MACD histogram has stayed negative.
- The MAs are in a full bearish stack: price ($32.33) < EMA21 ($41.50) < EMA55 ($51.10) < SMA50D ($52.17) < SMA200D ($75.61) < VWAP ($75.37).
- The EMA21/EMA55 crossover to the downside happened long ago, and the SMA50D is now well below the SMA200D. The death cross is established, and the gap is still widening.
- Price is about 57% below the SMA200D, which is a deeply entrenched long-term downtrend.
- ADX has climbed from 23.5 to 39.4 in 15 bars, so trend strength is accelerating.
- The MACD signal-line cross is bearish, and the histogram is expanding negative again after a brief narrowing.
- The stock has fallen from a ~$130 peak in late May to $32, a drop of about 75%.
CHART PATTERNS
- The chart shows a Bearish Head and Shoulders structure at the macro level: the ~$130 head in May, with a lower high later and a breakdown through the ~$54 area. The measured move has largely played out.
- The recent action from mid-September is a Bearish Flag / Rising consolidation around $38-$43, followed by a breakdown (the Oct–Nov drop). The flag's measured target points toward the low $30s to high $20s, so it is nearly achieved.
- No confirmed bullish reversal pattern (double bottom, falling wedge) is present yet. Price is near the multi-month low of ~$27-$30.
- Support lies around $27-$30. A break below would open the way to the low $20s.
POTENTIAL SCENARIOS
- Scenario 1: Bearish Trend Continuation — The strong downtrend (ADX 39, −DI dominant, CMF -0.22) continues, with price breaking below the $30.20 low and the lower Bollinger Band. Lower highs persist beneath the falling EMA21. Trigger: daily close below $30.20 / $27.00. Target: $24-$27, possibly $22 on an extension. Invalidation: daily close above the EMA21 (~$41). (50% probability)
- Scenario 2: Neutral Basing / Choppy Range — Capitulation volume leads to oversold stabilization, with price ranging between $27 and $38 for the period. Trigger: RSI holds above 30 and price holds $29-$30. Target: $30-$36 range. Invalidation: break below $27 or above $41.50. (28% probability)
- Scenario 3: Bullish Oversold Relief Rally — A sharp mean-reversion bounce from the lower band, with a retest of the EMA21 resistance. Trigger: RSI above 40 with MACD histogram turning positive. Target: $41-$44 (EMA21 and the prior breakdown level). Invalidation: failure at $38 and a rollover. (22% probability)
PRICE TARGETS
- Target Price: $29.00 (55-day target)
- Expected Range: $21.50 to $39.00 (width $17.50, about 54% of current price, which is wide because ASTS is highly volatile with ATR $4.19, or about 13% of price. It exceeds the generic 12-18% guide, but 55 days at this ATR justifies it)
- Key Levels: Support at $27.00, Resistance at $41.50
OVERALL BIAS
OVERALL BIAS: BEARISH - Price is in a strong downtrend (ADX 39.4, −DI 39.2 vs +DI 10.0) below every moving average. CMF at -0.217 shows persistent distribution and MACD is below its signal. RSI is oversold, which raises the odds of a bounce, but nothing confirms a reversal yet.
This is educational analysis and not financial advice.