META 55-day bearish forecast — Nov 8, 2026
- Bias: Bearish
- Timeframe: 55 days (made Nov 8, 2026, target date Jan 1, 2027)
- Price at analysis: $610.15
- Price target: $585.00
- Expected range: $555.00 – $655.00
- Result: Pending — graded after the close on Jan 1, 2027
Get a free AI analysis of META today
Analysis
TECHNICAL INDICATORS
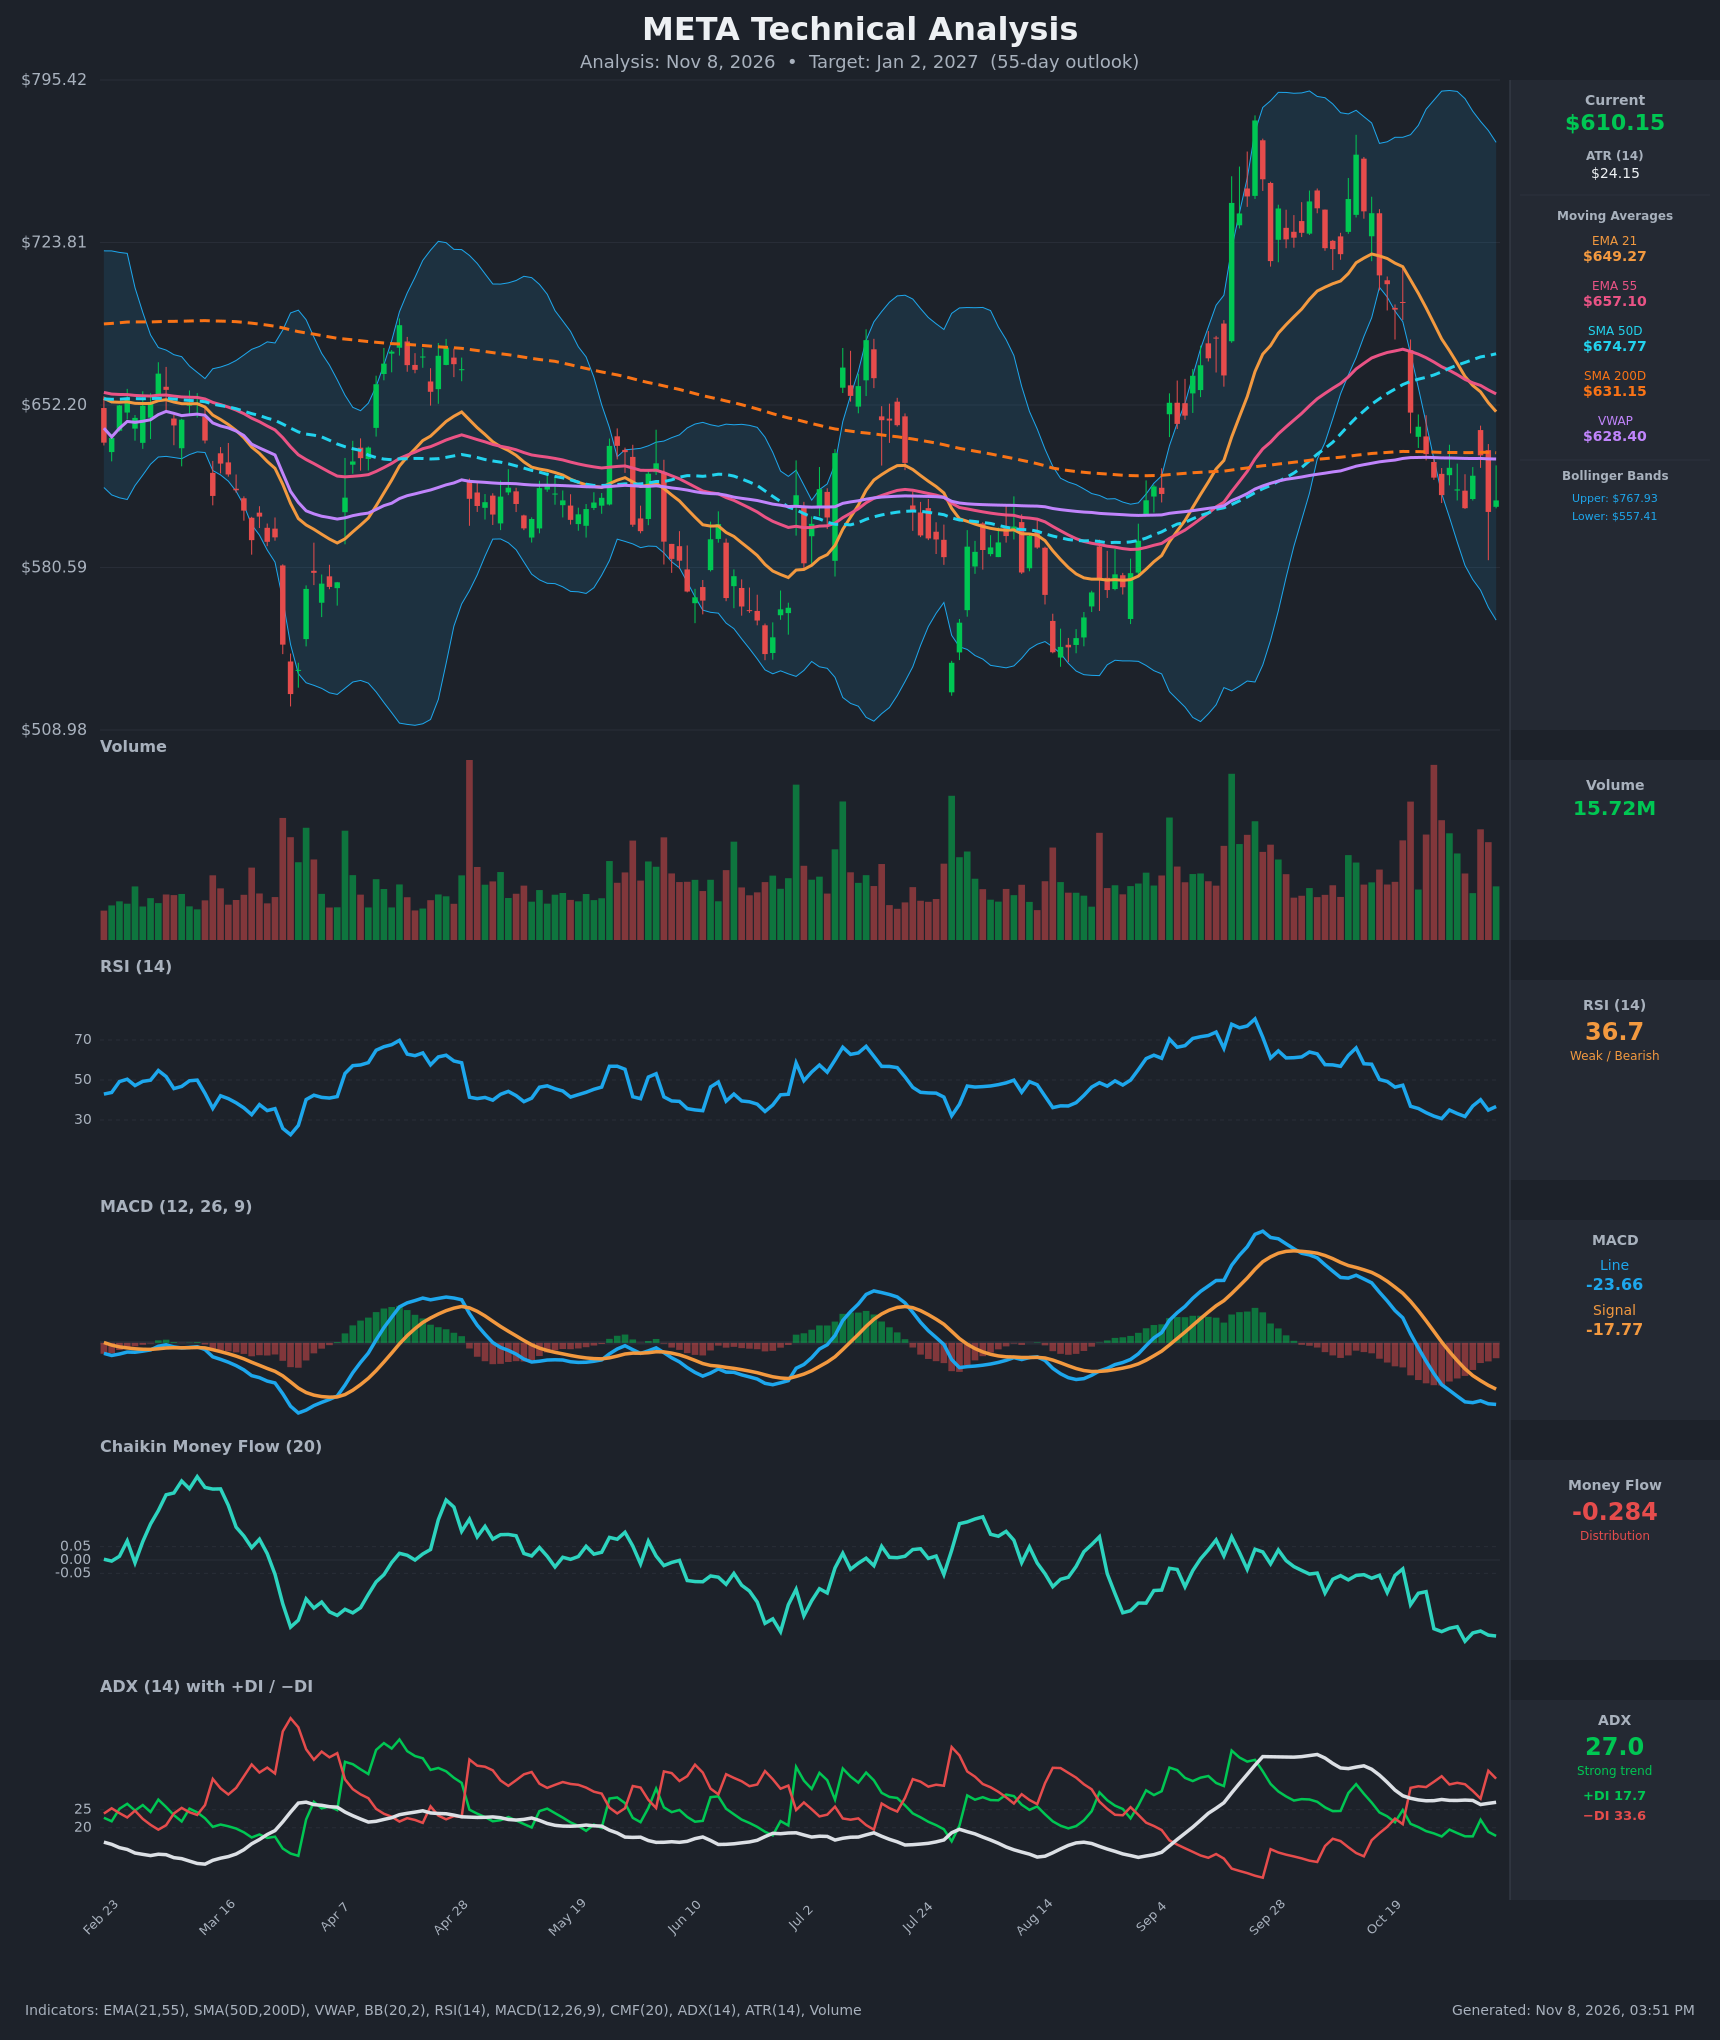
- RSI (14): 36.74, in the weak zone just above oversold (<30). It bottomed near 30.7 on Oct 28 and has chopped between 31 and 40 since, making no higher highs. Momentum is still bearish, with a slight attempt to stabilize. [Bearish]
- 20 EMA: The data gives EMA 21 at $649.27, and price at $610.15 is about 6% below it. The EMA is sloping down steeply, from $716 on Oct 19, and now acts as dynamic resistance. EMA21 is also about to cross below EMA55 ($657.10), a bearish crossover in progress. [Bearish]
- MACD: Line -23.66 is below Signal -17.77, a bearish crossover that occurred around Oct 28. The histogram is about -5.9 and still widening. Both lines are below zero and falling, so downside momentum is intact. [Bearish]
- Bollinger Bands (20): Upper $767.93, lower $557.41, midline about $662.7. Price sits in the lower third, roughly 25% of the band width above the lower band. The bands are wide, reflecting the September spike and October drop. A walk toward the lower band is possible, but there is no tag yet. [Bearish]
- CMF (20): -0.284, deeply negative and well below the -0.05 threshold. It has been persistently negative and made new lows in early November, so there is heavy, sustained distribution. [Distribution]
- ADX (14): 27.0, above 25, signalling a strong trend. −DI (33.6) is far above +DI (17.7), so bears are firmly in control. ADX has been flat to slightly lower from 32.6, so the trend is mature but still strong. [Strong Trend – Bearish]
- Volume: 15.72M on the latest bar, with heavy selling volume during the October decline (large red bars in late Oct). The current bar is lower and shows a small green candle, so there is no capitulation spike yet. [Bearish – distribution on down days]
DIVERGENCES & TRENDS
- No clear bullish RSI divergence. RSI made a slightly higher low (about 31-33) versus the Oct 28 low, but price made lower lows ($606.73, $605.08), so there is a mild, unconfirmed hint at best.
- MACD and CMF are making new lows alongside price, so they confirm the downtrend rather than diverge.
- Crossovers:
- MACD bearish cross (late Oct).
- EMA21 is about to cross below EMA55.
- −DI crossed above +DI on Oct 20-22 and has stayed above.
- Price broke below the SMA50D ($674.77) and EMA21/55 in late October.
- SMA50D ($674.77) is above SMA200D ($631.15), so there is no death cross, but the SMA50D is rolling over in the near term.
- Price at $610.15 is below the SMA200D ($631.15) and VWAP ($628.40), so it has lost the long-term trend line. The 200D now acts as resistance. The lows near $557-$580 from earlier in the year (the Aug-Sep base) are the next major support zone.
- The Sep-Oct rally to about $770 has fully reversed, leaving a lower high.
CHART PATTERNS
- Bearish Head and Shoulders (broad, loosely formed): The structure from Aug to Nov could be read this way. The left shoulder is around $690-$700 (Jul), the head is the Sep peak near $770, and the right shoulder is the Oct bounce near $700-$715. The neckline is roughly $580-$600 (the Aug base). Price is approaching the neckline, and a close below it would imply a measured move of about $170 lower (head $770 minus neckline $590), toward $420-$450 in the long run. For a 55-day window, partial progress is more realistic.
- Bearish Pennant / Flag potential: The tight consolidation in the $605-$630 range over the last two weeks may be a bearish flag after the sharp drop from $697 to $612. A break lower would project roughly $85-$90 of downside from the breakdown level, toward $520-$540.
- Support to watch: The $557 lower Bollinger Band and the earlier cycle lows around $580 and $560. A failure here would extend the pattern targets.
POTENTIAL SCENARIOS
- Scenario 1: Bearish Continuation Toward Neckline/Lower Support — Price stays below the falling EMAs and SMA200D, and the bearish MACD, −DI dominance and distribution persist. Sellers push through the $605 recent lows and probe the $560-$580 support zone. Trigger: close below $600, then below $580. Target: $560-$575. Invalidation: daily close above $650 (EMA21 and SMA200D reclaimed). (50% probability)
- Scenario 2: Neutral/Bounce-and-Range — RSI near 30-37 supports a relief rally into the $635-$655 resistance cluster (SMA200D/VWAP/EMA21), followed by a stall and a range between $580 and $650. Trigger: hold of $600 and RSI move above 45. Target: $600-$640. Invalidation: break below $575 or above $660. (30% probability)
- Scenario 3: Bullish Reversal — Selling exhaustion pushes price back above the 200D and 21 EMA, and the move retraces toward the SMA50D. Trigger: close above $650 on rising volume with a CMF turn toward zero. Target: $675-$690. Invalidation: loss of $600. (20% probability)
PRICE TARGETS
For a 55-day horizon, the range width should be ~12-18% of current price. The range is $555 to $655, a $100 width, or about 16.4% of $610.15.
- Target Price: $585.00 (55-day target; a modest decline from $610.15 consistent with the bearish structure, with room for a relief bounce)
- Expected Range: $555.00 to $655.00
- Key Levels: Support at $580.00, Resistance at $631.15
OVERALL BIAS
OVERALL BIAS: BEARISH - Price is below the falling EMA21/55, SMA200D and VWAP, with a bearish MACD cross, −DI dominating at ADX 27, and deeply negative CMF (-0.284) showing persistent distribution. Oversold RSI argues for bounces, but the weight of evidence points to a test of the $560-$580 support zone.
This is educational analysis and not financial advice.