MU 55-day bearish forecast — Nov 8, 2026
- Bias: Bearish
- Timeframe: 55 days (made Nov 8, 2026, target date Jan 1, 2027)
- Price at analysis: $690.00
- Price target: $650.00
- Expected range: $590.00 – $710.00
- Result: Pending — graded after the close on Jan 1, 2027
Get a free AI analysis of MU today
Analysis
TECHNICAL INDICATORS
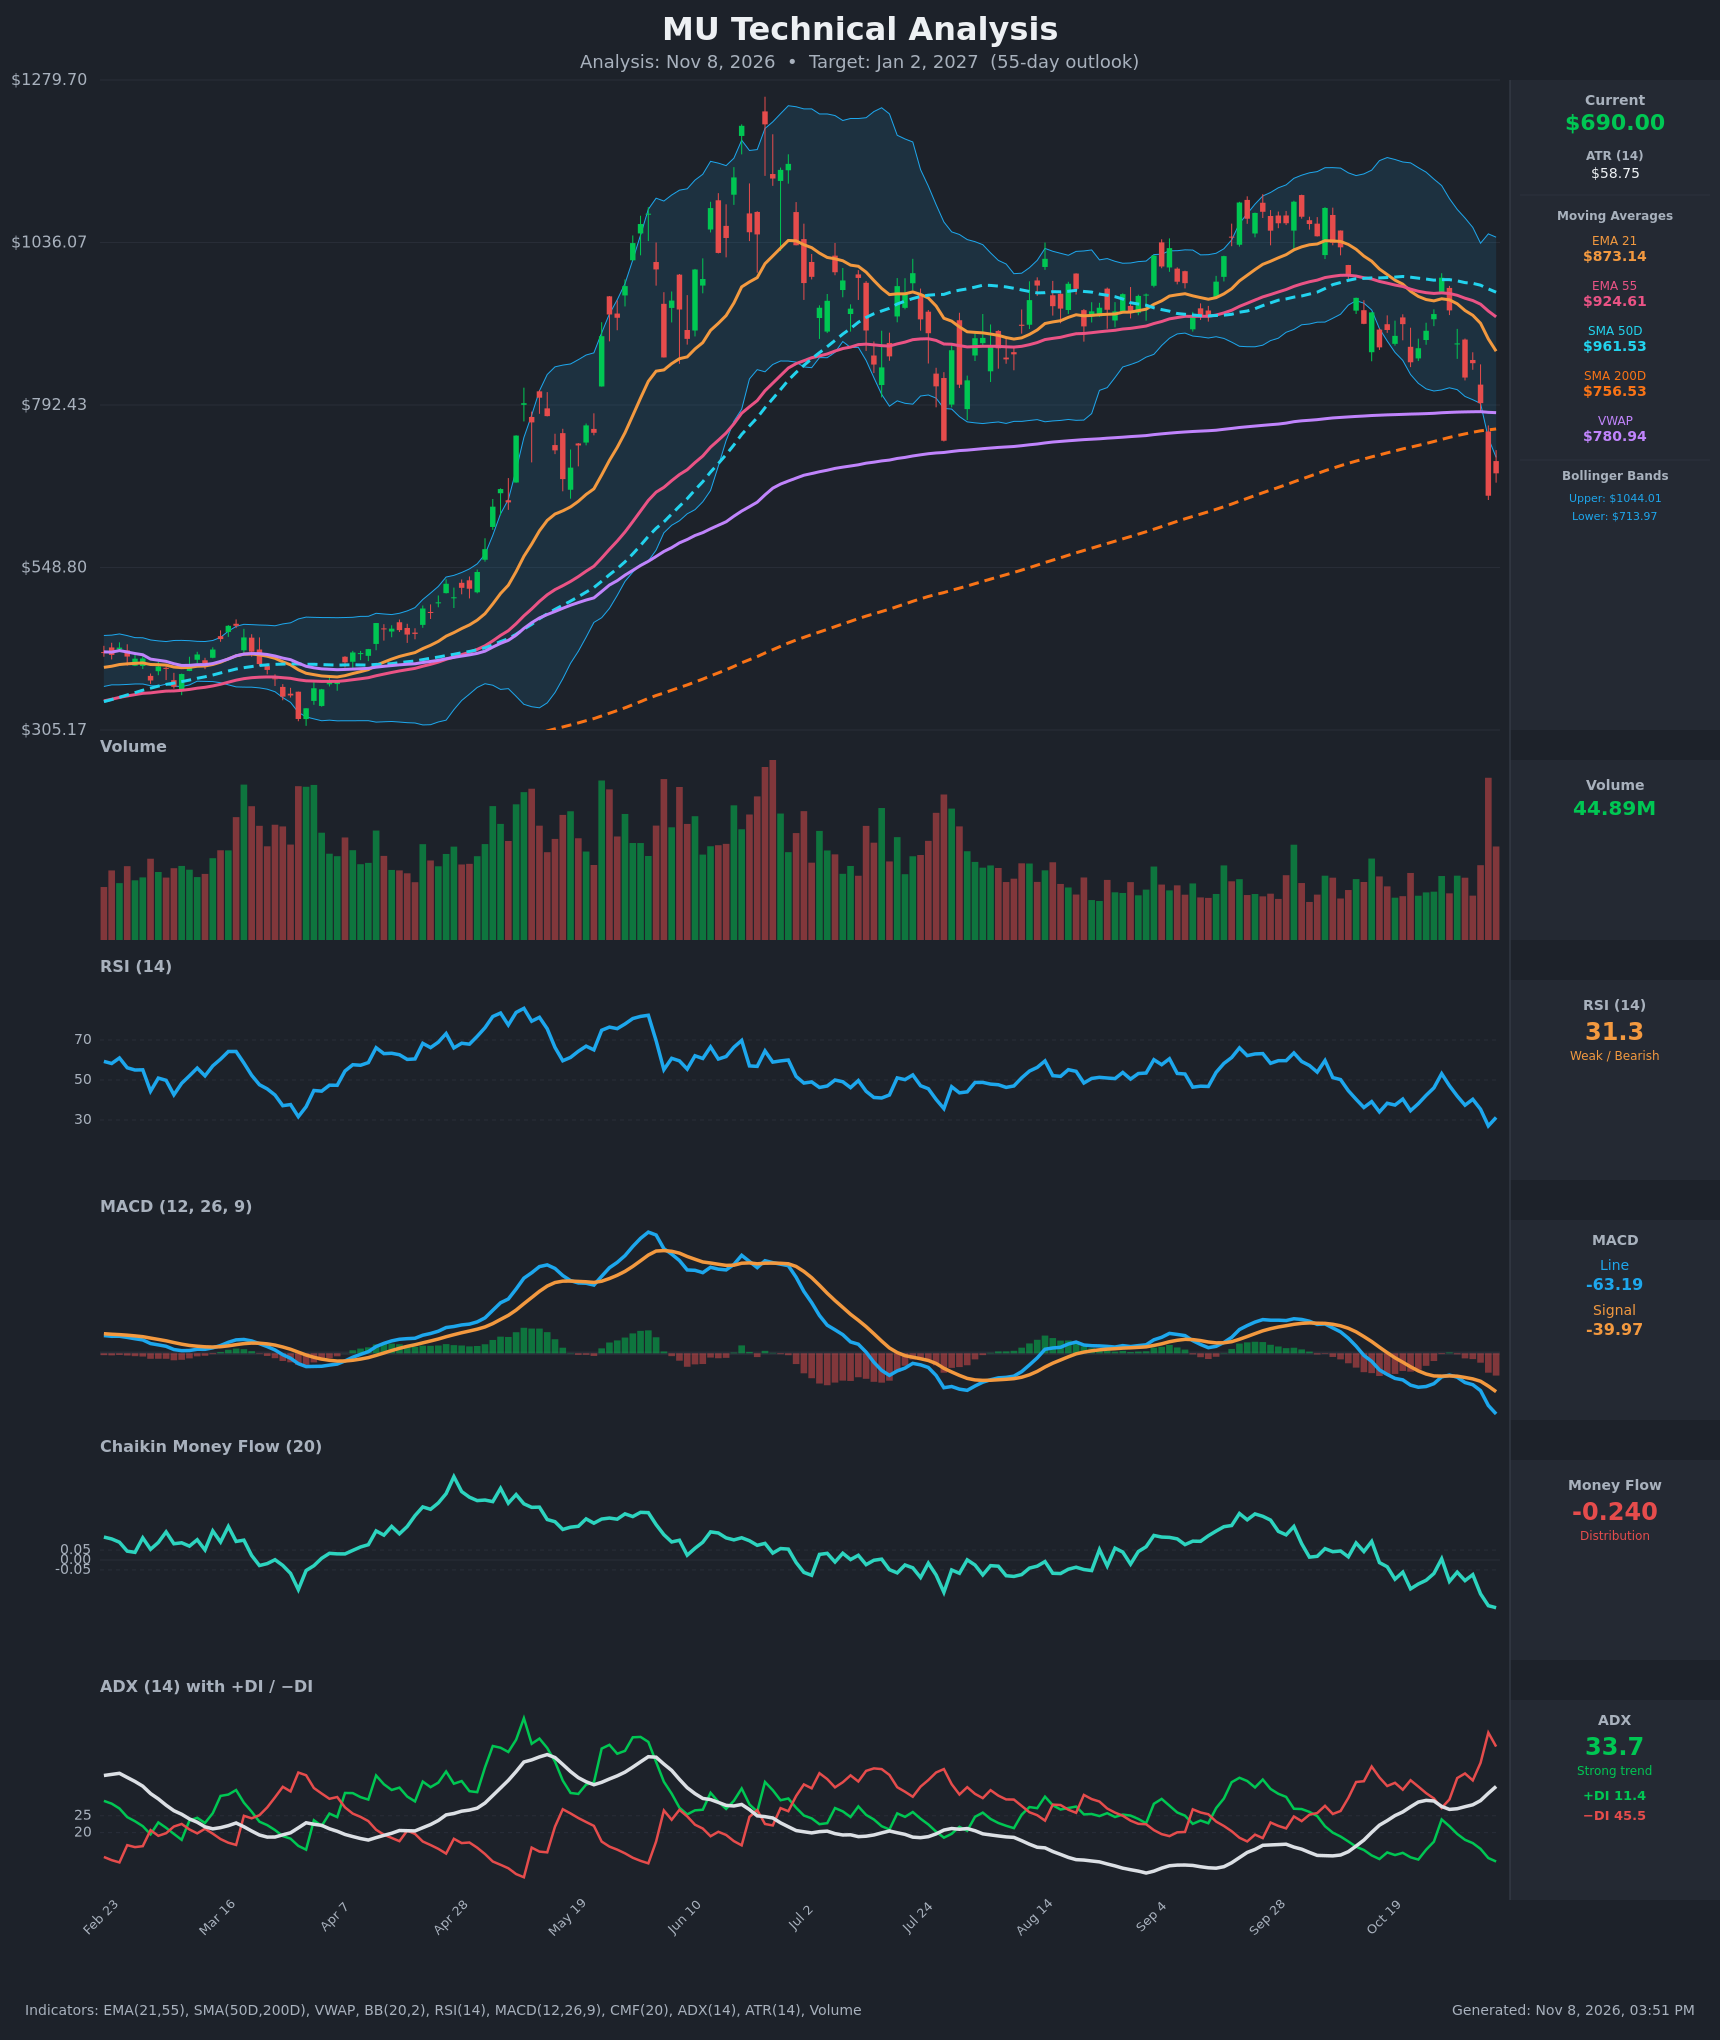
- RSI (14): 31.27, up slightly from 27.1 on Nov 5, which was the lowest reading in the recent window. It is near oversold but has not shown a real bullish turn. Readings have made lower highs since the Oct 28 spike to 53. [Bearish]
- 20 EMA (EMA 21 = $873.14): Price at $690 is about 21% below it, and the EMA is falling steeply. EMA 21 crossed below EMA 55 ($924.61) around Oct 28 and the gap is widening. Both now act as overhead resistance. [Bearish]
- MACD: Line -63.19 is below signal -39.97, a gap of about -23. It has been below signal since Oct 19 and is accelerating lower. The histogram is increasingly negative and the line is at its lowest level on the chart. [Bearish]
- Bollinger Bands (20): Upper $1044.01, lower $713.97. Price at $690 sits below the lower band, and the bands are wide, reflecting expanded volatility. This is a stretched, oversold condition. In a strong downtrend, a close below the lower band often means a "band walk" rather than an immediate reversal. [Bearish]
- CMF (20): -0.240, well below -0.05 and the weakest reading in the window. It has fallen from -0.034 on Oct 19, and the only positive print was a marginal +0.006 on Oct 28. This shows heavy, persistent distribution. [Distribution]
- ADX (14): 33.7 and rising from 23.6, so the trend is strengthening. −DI at 45.5 is far above +DI at 11.4, which is a decisive bearish dominance. [Strong Trend – Bearish]
- Volume: 44.89M, the highest in the visible window, on the Nov 5 gap-down red candle (-17.5%). This is a high-volume breakdown, which may include capitulation. Nov 6 followed with a small bounce on lower volume. Price is also below VWAP ($780.94). [Bearish – high-volume breakdown]
DIVERGENCES & TRENDS
- No bullish divergence yet. RSI made a new low at 27.1 on Nov 5, in line with price, and MACD and CMF both made new lows with price. The indicators confirm the move.
- Moving-average structure: Price is below EMA 21, EMA 55, SMA 50D ($961.53), VWAP ($780.94) and now SMA 200D ($756.53). The Nov 5 candle sliced through SMA 200D and VWAP in one session, a major long-term support loss.
- SMA crossovers: No death cross yet (SMA 50D $961.53 is still above SMA 200D $756.53), but SMA 50D is now rolling over. The EMA 21/55 bearish cross on Oct 28 and the MACD signal cross are confirmed.
- DI and ADX: −DI has been above +DI since Oct 19 and the gap widened sharply to 34 points. ADX is rising above 25, which confirms a trending decline.
- Trend of highs: The June peak was near $1250 and the Sep high near $1100. This is a lower-high structure followed by a breakdown from the $830-$1000 range.
- Oversold risk: RSI near 30, price below the lower BB, and a capitulation-style volume spike raise the odds of a relief bounce. However, nothing yet confirms a trend reversal.
CHART PATTERNS
- Bearish rectangle / range breakdown (Triple Top-like): From July to October, price oscillated between roughly $830 and $1050 (a lower high versus the June peak). The Nov 5 gap-down broke below the range floor. The range height of about $200 projects a measured move to roughly $630 from the ~$830 breakdown level.
- Lower-high reversal structure: The June peak near $1250 followed by the weaker Sep high near $1100 resembles a Bearish Double Top / distribution. The trend is now rolling over toward the SMA 200D and below.
- Bear-flag potential: A weak bounce into $740-$780, below the broken SMA 200D and VWAP, would form a bear flag or retest. That would project a further decline toward $600-$630.
- Counter-pattern: If price quickly reclaims $757 and holds, the move would be a failed breakdown (bear trap) with room to $780-$870.
POTENTIAL SCENARIOS
- Scenario 1: Bearish Continuation / Breakdown Extension — The breakdown of the $830-$1050 range and the loss of SMA 200D continue. Price consolidates or bounces weakly, then rolls over again as −DI stays dominant and CMF stays negative. Trigger: close below $656 (the Nov 5 close), or failure at $714-$757. Target: $620-$650, with extension toward $590. Invalidation: daily close above $757 (SMA 200D) with a MACD histogram turn. (50% probability)
- Scenario 2: Bullish Oversold Relief Rally — Capitulation volume and an RSI near 30 trigger mean reversion back toward the broken support and VWAP. Trigger: reclaim of the $714 lower BB, then $757. Target: $757-$781 (SMA 200D / VWAP), with a stretch toward $873 (EMA 21). Invalidation: rejection at $757-$781 and a close back below $656. (35% probability)
- Scenario 3: Neutral Base Building — Price chops between roughly $640 and $750 as the selloff exhausts, with ADX cooling from 33. Trigger: several sessions of low volume with a flat RSI near 35-40. Target: $660-$720. Invalidation: close outside $620-$757. (15% probability)
PRICE TARGETS
- Target Price: $650.00 (55 days, to around Jan 2, 2027)
- Expected Range: $590.00 to $710.00 (width $120, about 17.4% of the $690 current price, consistent with the 30-60 day guidance of 12-18%)
- Key Levels: Support at $656.39 (Nov 5 close; below it, $600), Resistance at $756.53 (SMA 200D; the lower BB at $713.97 is nearer minor resistance)
OVERALL BIAS
OVERALL BIAS: BEARISH - Price has broken below SMA 200D, VWAP and all key averages on a high-volume gap-down. MACD, CMF (-0.240) and ADX/DI (−DI 45.5 vs +DI 11.4) all confirm strong selling. The range-breakdown measured move points toward the low $600s to $650, although the oversold RSI makes a relief bounce into $714-$757 likely along the way.
This is educational analysis and not financial advice.