ASTS 83-day bearish forecast — Nov 8, 2026
- Bias: Bearish
- Timeframe: 83 days (made Nov 8, 2026, target date Jan 29, 2027)
- Price at analysis: $32.33
- Price target: $29.50
- Expected range: $24.50 – $34.00
- Result: Pending — graded after the close on Jan 29, 2027
Get a free AI analysis of ASTS today
Analysis
TECHNICAL INDICATORS
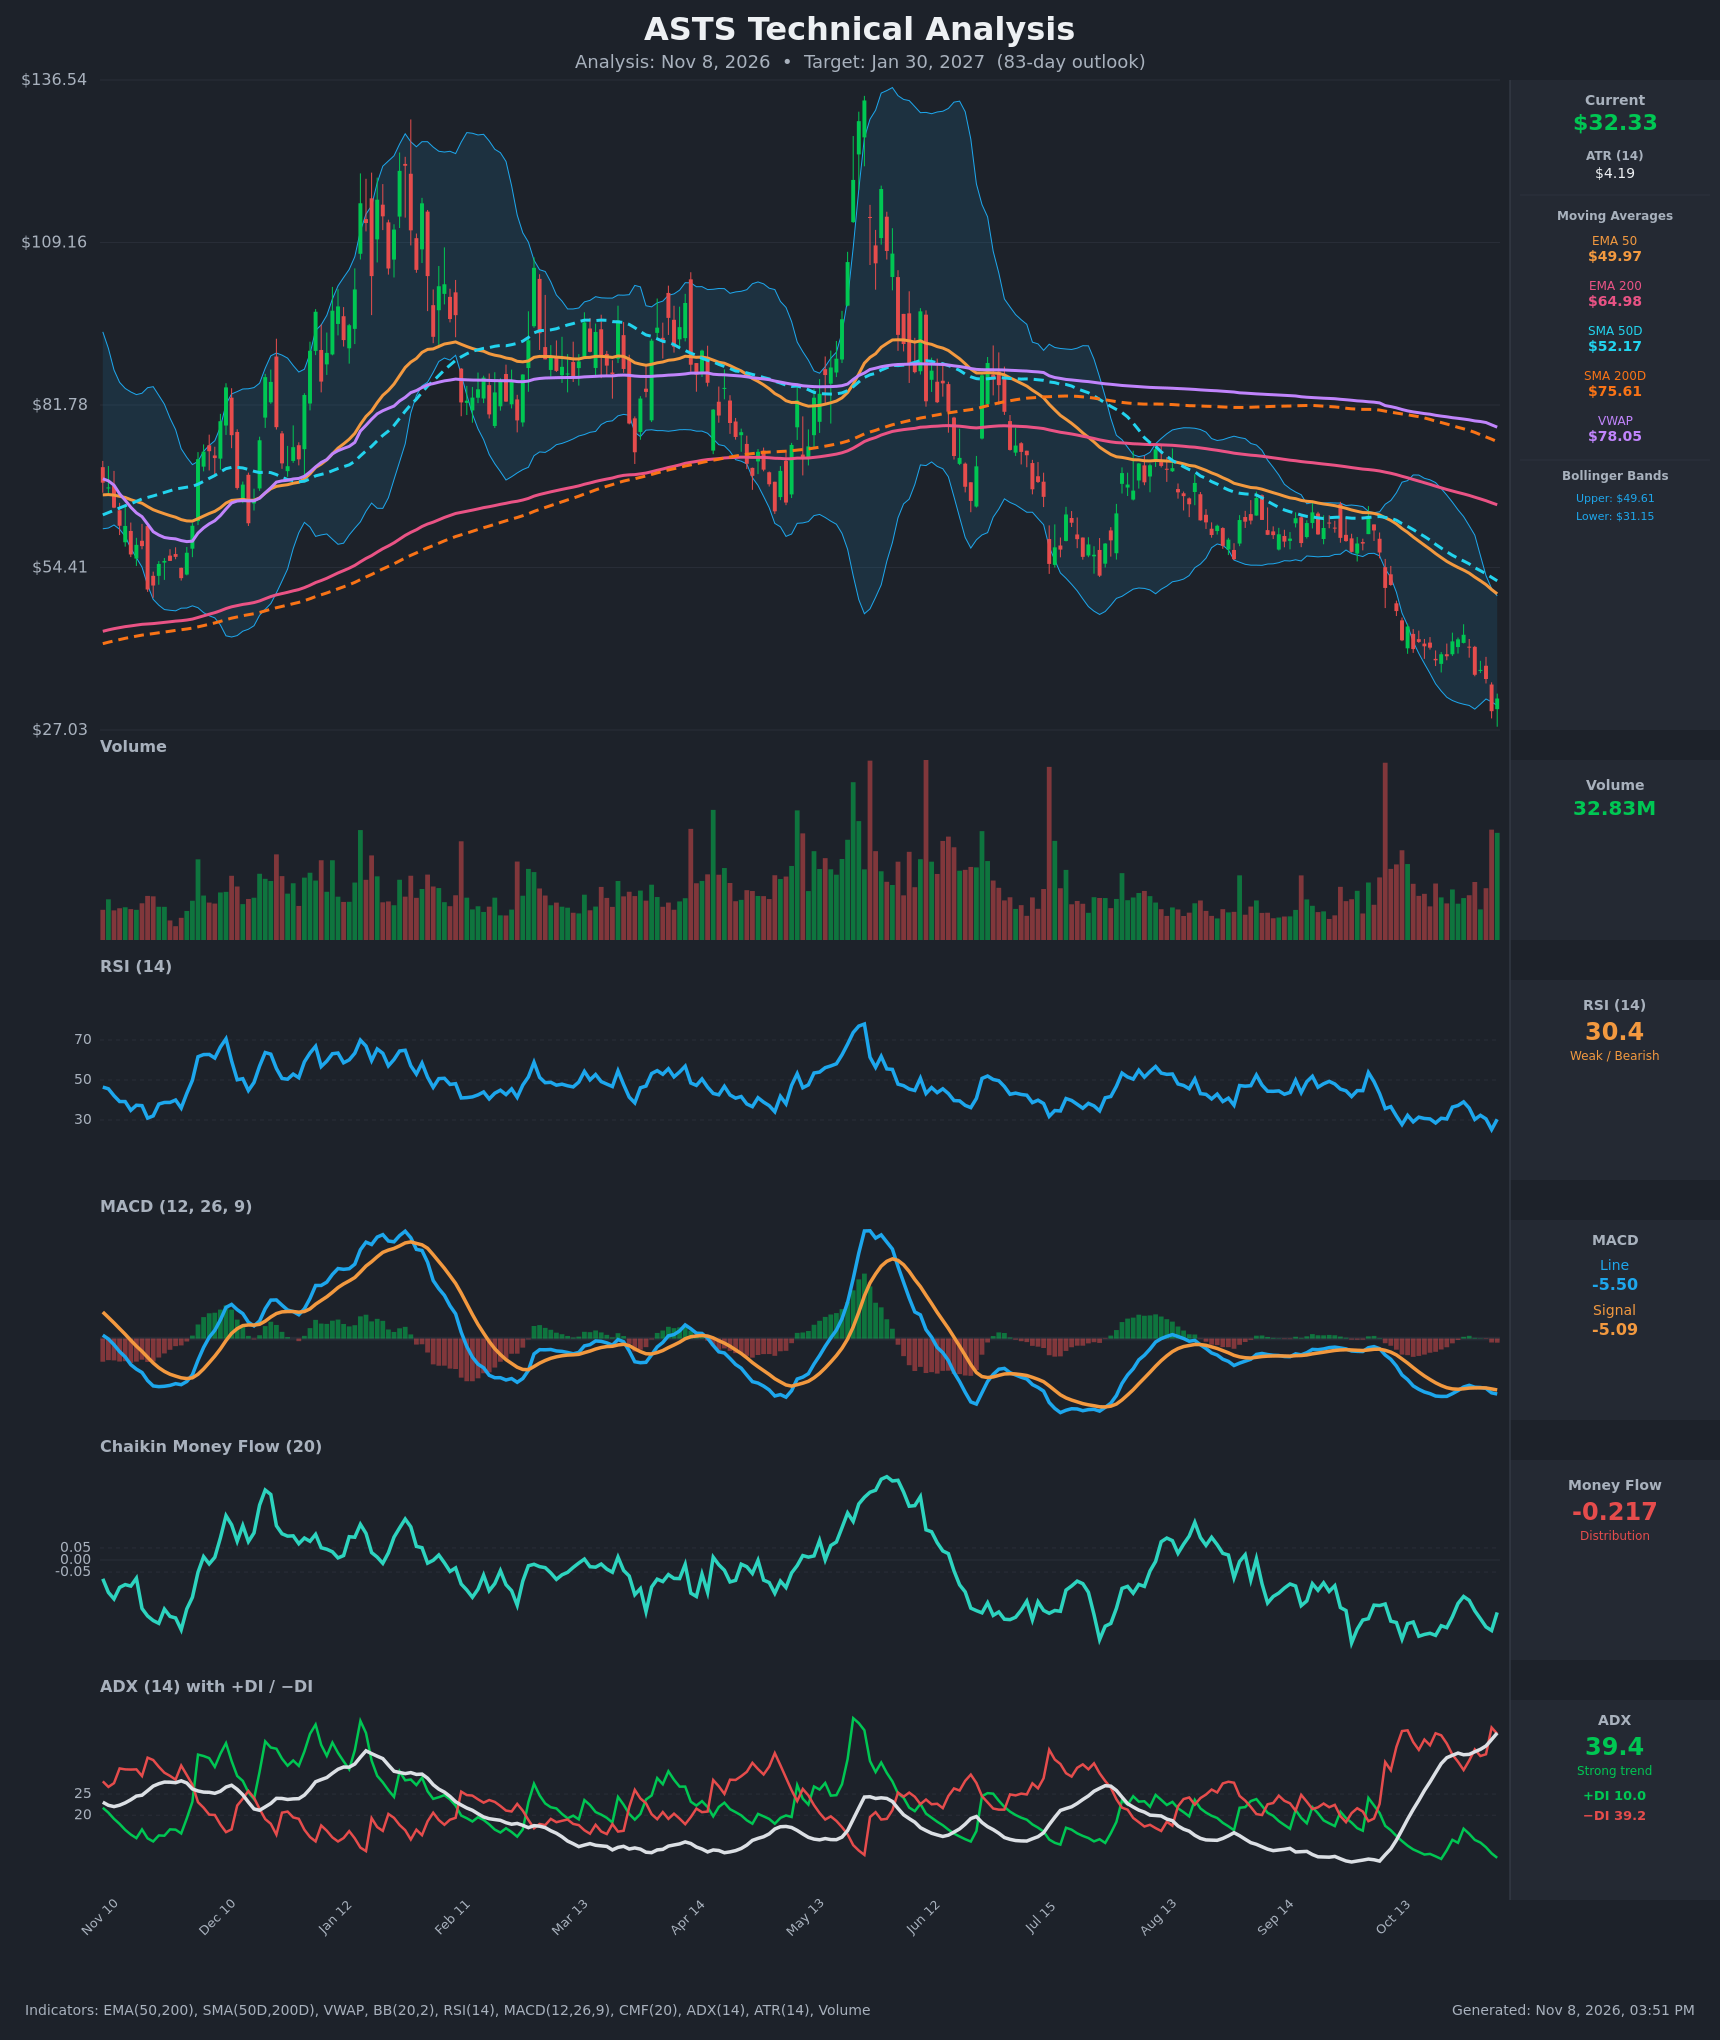
- RSI (14): 30.36, right at the oversold threshold. It dipped to 25.2 on Nov 5 and bounced to 30.4. It has been pinned in the 25-39 band for about three weeks, which signals persistent downside momentum rather than a reversal. Oversold readings can stay oversold in strong downtrends. [Bearish]
- 20 EMA: No 20 EMA value was supplied. Using the Bollinger mid-band (20-period basis, about $40.38) and the EMA 50 ($49.97) as proxies, price at $32.33 is far below both. They act as dynamic resistance, and rallies have been rejected near $41-43. [Bearish]
- MACD: Line -5.495 is below signal -5.090, so the histogram is about -0.41 and widening. A brief bullish cross on Oct 29 failed, and a bearish cross returned on Nov 4. Both lines sit deep below zero and are falling. [Bearish]
- Bollinger Bands (20): Upper $49.61, lower $31.15, with price at $32.33 hugging the lower band. This is a "band walk" since the October breakdown. The bands are expanding, which confirms volatility with a bearish trend. A close back inside the mid-band ($40.38) would be needed to signal a relief move. [Bearish]
- CMF (20): -0.217, well below -0.05, and negative for months. It has not turned positive on any bounce, so sellers dominate. It improved slightly from -0.292 on Nov 5. [Distribution]
- ADX (14): 39.4 and rising (23.5 → 39.4 in 15 bars), with −DI 39.2 far above +DI 10.0. This is a strong, accelerating downtrend with bears firmly in control. ADX above 35-40 can mark a mature trend that is vulnerable to exhaustion. [Strong Trend – Bearish]
- Volume: 32.83M, the highest bar in recent months, on a small green candle after a sharp Nov 5 flush. This may be capitulation or a bounce attempt, but one high-volume bar does not confirm a bottom. Down-bar volume has dominated during the October decline. [Mixed – possible capitulation, unconfirmed]
- Moving averages (supplementary): Price is below EMA50 ($49.97), EMA200 ($64.98), SMA50D ($52.17), SMA200D ($75.61) and VWAP ($78.05). SMA50D is below SMA200D (a death cross already in place), and EMA50 is below EMA200. [Bearish]
DIVERGENCES & TRENDS
- RSI: The Nov 5 low of 25.2 is a new RSI low, and price made a new low at $30.20. There is no clean bullish divergence yet. The RSI lows at the Oct 22 low (28.5) and Nov 5 low (25.2) confirm the price lows.
- MACD: Both lines are making lower lows, and the failed Oct 29 bullish cross is a bear-trend signal.
- CMF: It is stuck in negative territory with no accumulation bounce, which confirms the price decline.
- ADX/DI: −DI crossed above +DI in early Oct and has stayed dominant. ADX is climbing steadily, so trend strength is increasing.
- Moving average structure: Price is well below the falling EMA50 and SMA50D, and the 50s are below the 200s. Every rally since August has been sold at or below the 50-period averages.
- Stretch: Price is roughly 35% below EMA50 and at the lower Bollinger Band. A mean-reversion bounce is plausible, but it would likely be a counter-trend rally.
CHART PATTERNS
- Bearish Double Top (large scale): The peaks near $128 (Jan) and $130 (May) with the neckline around $63-65 have long since broken. The measured target is already exceeded, so this pattern is more context than trade guidance.
- Bearish Flag / Descending Channel (continuation): Price drifted sideways to lower in a $55-65 range during Aug-Sep, then broke down to about $40. A second small flag formed around $38-43, followed by the break to $30. Each flagpole is about $12-15, and repeated breaks suggest further measured-move downside.
- Bullish counter-view: The Nov 5 flush into the lower band on peak volume, followed by a green candle, could be an early Bullish Falling Wedge or capitulation low. This is not confirmed unless price reclaims $37-40.
- Targets: The pattern-based downside target is roughly $24-27, near the chart low and the round-number zone. The upside relief target is $40-42, the prior flag top and Bollinger mid-band.
POTENTIAL SCENARIOS
- Scenario 1: Bearish Trend Continuation — The ADX 39 trend persists, with −DI dominant, CMF in distribution and price below all key averages. Rallies fail at $37-40 and price grinds lower with volatility. Trigger: a daily close below $30.20 (Nov 5 low), then $27. Target: $24.50-$29.50. Invalidation: a daily close above $40.40 (Bollinger mid-band) with CMF turning positive. (45% probability)
- Scenario 2: Bullish Oversold Relief Rally — Capitulation volume and an RSI-30 washout trigger a mean-reversion bounce toward the declining averages, then another leg down or a base. Trigger: a close above $37.15-$39.80, with MACD histogram turning up and CMF crossing above -0.05. Target: $40-$45 (mid-band, EMA50 area near $50 if extended). Invalidation: a close below $27. (38% probability)
- Scenario 3: Neutral Base-Building — Price chops in a $27-$38 range as selling exhausts but buyers do not follow through. Trigger: ADX rolling over from about 40 with RSI oscillating 30-45. Target: $30-$35. Invalidation: a break of either $27 or $40. (17% probability)
PRICE TARGETS
- Target Price: $29.50 (83-day horizon, ending about Jan 30, 2027)
- Expected Range: $24.50 to $34.00 (width $9.50, about 29.4% of current price, consistent with the 61-180 day guideline)
- Key Levels: Support at $27.03, Resistance at $39.50
OVERALL BIAS
OVERALL BIAS: BEARISH - ADX is 39 and rising with −DI far above +DI, price is below every major moving average and VWAP with a death cross in place, CMF shows persistent distribution, and MACD is back below signal. The oversold RSI and the high-volume bounce bar raise the risk of a relief rally, but the evidence favors a bearish continuation or retest of lows over a confirmed reversal.
This is educational analysis and not financial advice.