INTC 83-day bearish forecast — Nov 8, 2026
- Bias: Bearish
- Timeframe: 83 days (made Nov 8, 2026, target date Jan 29, 2027)
- Price at analysis: $56.28
- Price target: $52.50
- Expected range: $46.00 – $63.00
- Result: Pending — graded after the close on Jan 29, 2027
Get a free AI analysis of INTC today
Analysis
TECHNICAL INDICATORS
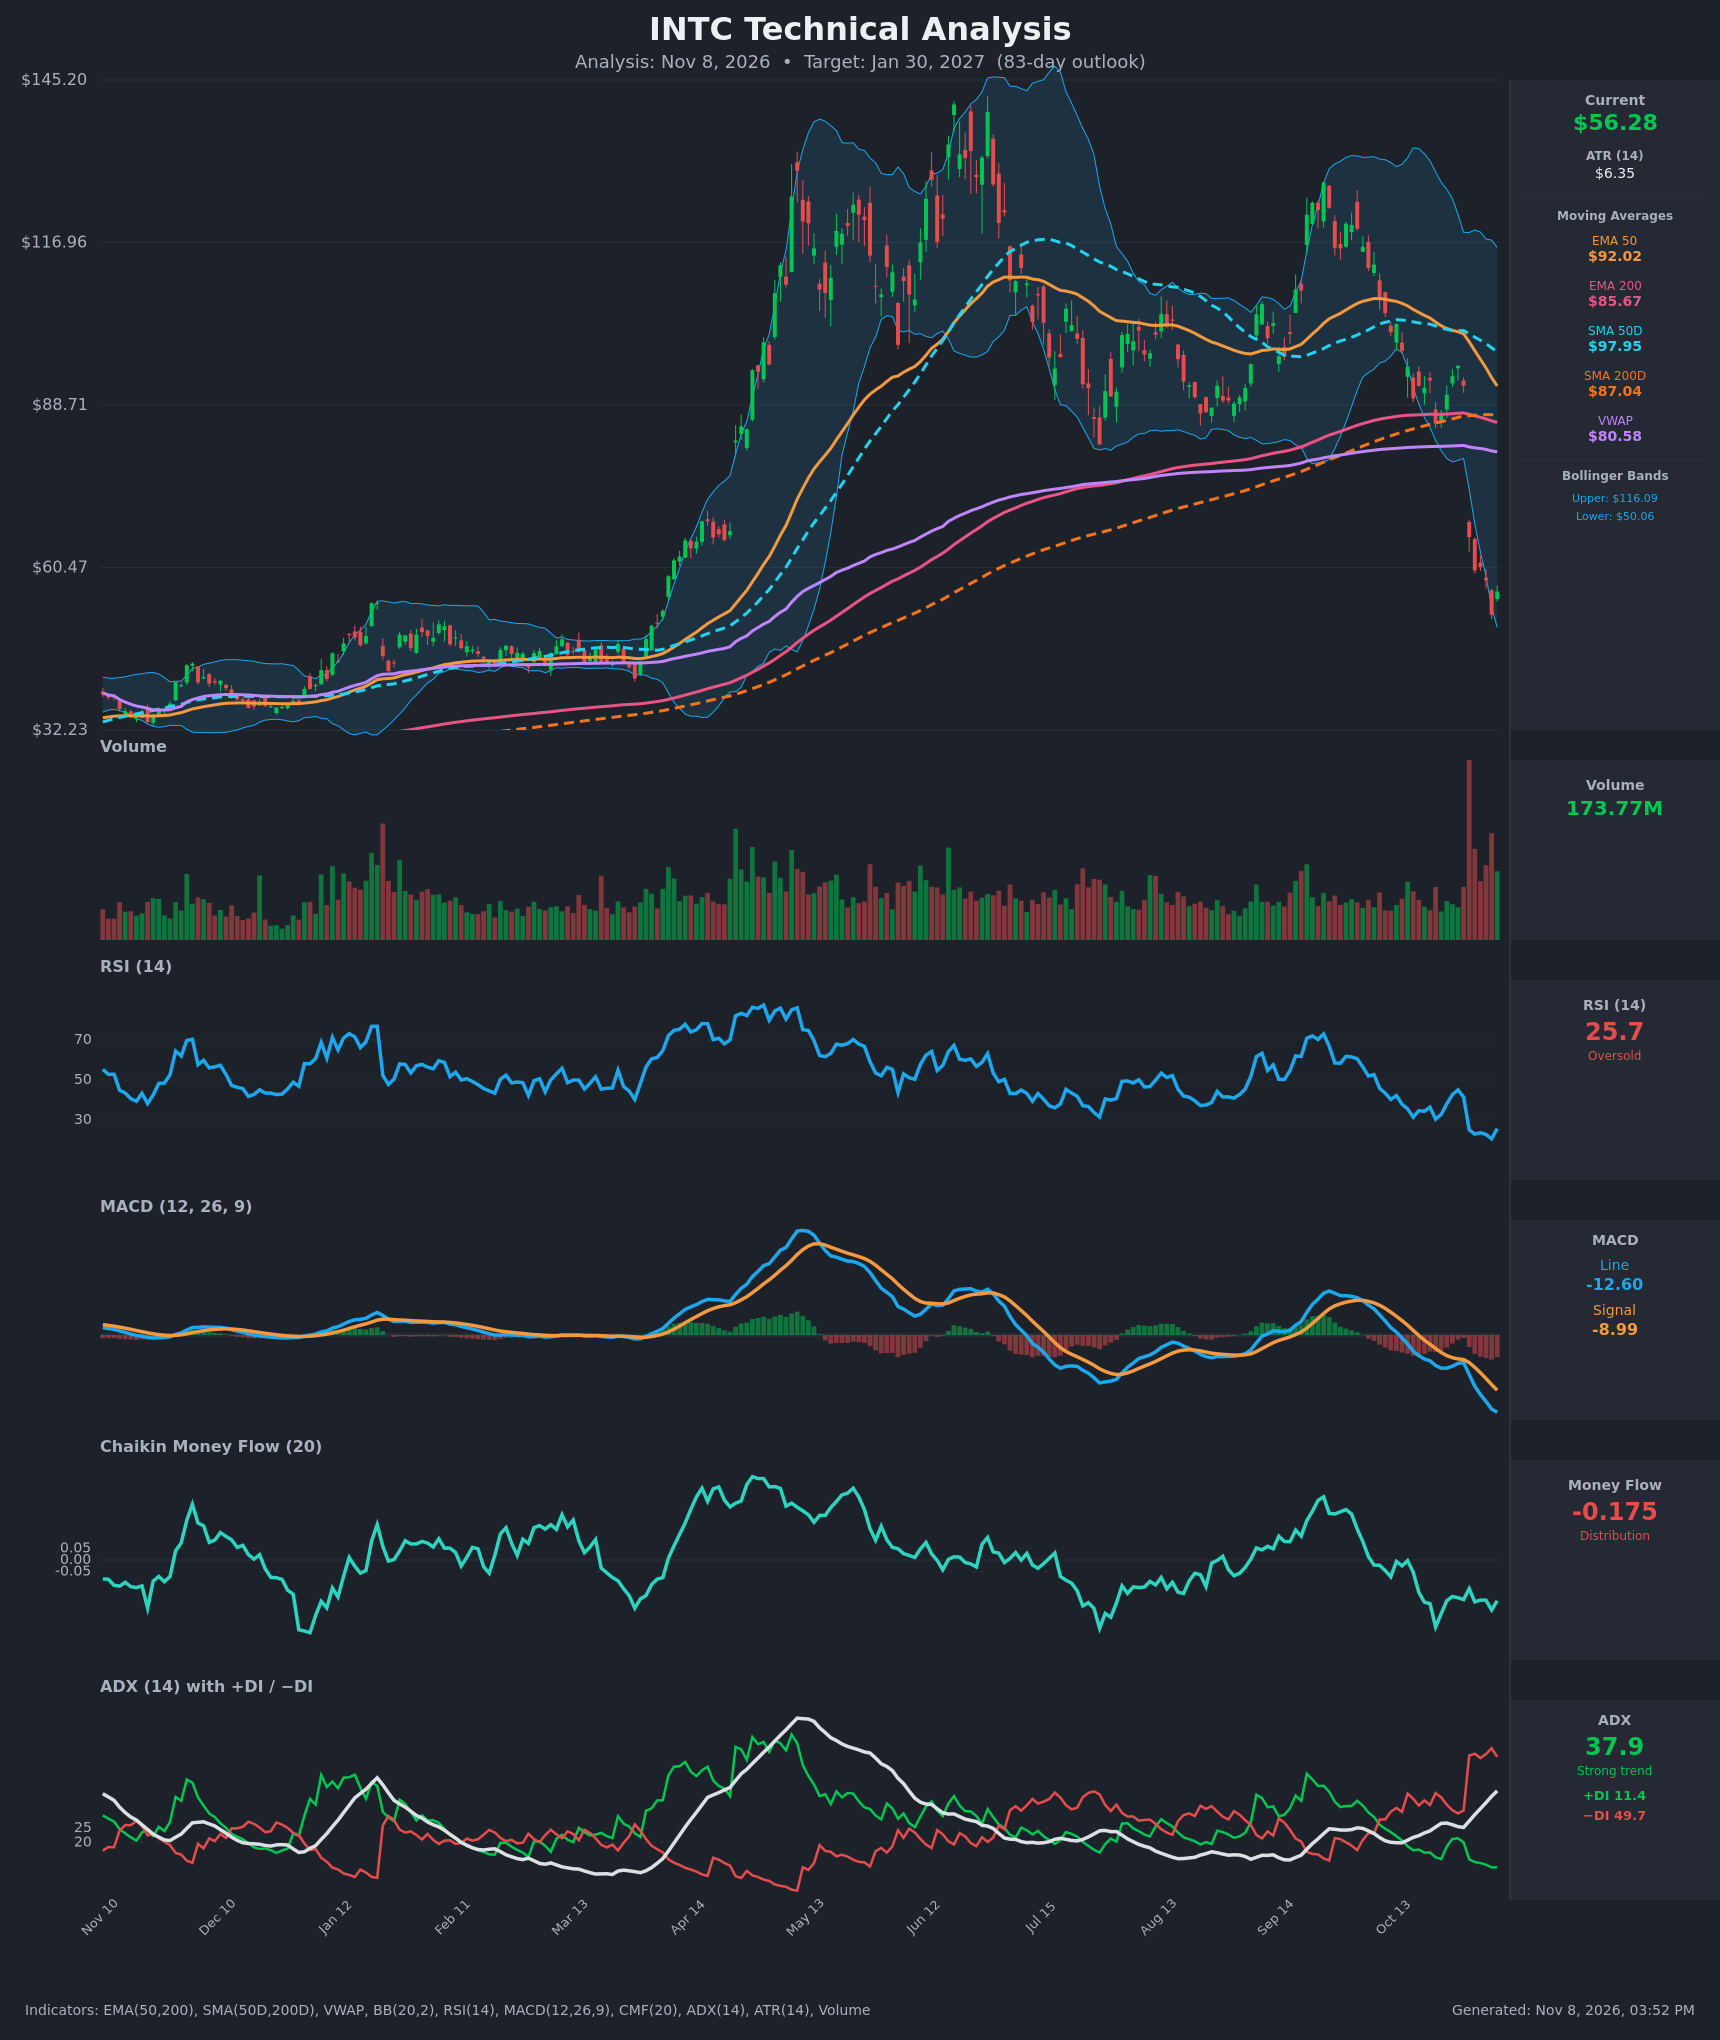
- RSI (14): 25.72, oversold. It bottomed at 20.6 on Nov 5 and ticked up to 25.7 on the latest bar. The oversold reading raises bounce odds, but RSI has been below 30 for most of the last 7 sessions and has not yet formed a higher low. [Bearish]
- 20 EMA / MAs: The 20 EMA is not provided, so I use the provided EMAs. Price ($56.28) is far below EMA50 ($92.02, about 39% above price), EMA200 ($85.67), SMA50D ($97.95), SMA200D ($87.04) and VWAP ($80.58). Every one of these is now overhead resistance, and EMA50 is falling fast toward EMA200. [Bearish]
- MACD: The line is -12.60 against a signal of -8.99, so the histogram is about -3.6 and still widening. The line crossed below the signal in mid-October and has kept diverging, with no sign of a turn. [Bearish]
- Bollinger Bands (20): The bands are very wide (upper $116.09, lower $50.06) after the gap-down. Price tagged the lower band on Nov 5 ($52.25) and bounced to $56.28, which is a lower-band bounce, not a reversal. Walking the band is possible in a trend this strong. [Bearish]
- CMF (20): -0.175, well below -0.05. It has been negative for weeks (about -0.12 to -0.29) with no accumulation, which means persistent selling pressure. [Distribution]
- ADX (14): 37.9 and rising from 22 two weeks ago. −DI at 49.7 dominates +DI at 11.4, a very wide gap. This is a strong, established downtrend. [Strong Trend – Bearish]
- Volume: 173.77M on the latest bar. The Oct 30 crash day and the following sessions had by far the heaviest volume on the chart, mostly on red bars. That is capitulation-style distribution, and the last bar is a green, high-volume bounce. Volume confirms the breakdown, though a spike like this can mark a short-term exhaustion low. [Heavy selling / possible exhaustion]
DIVERGENCES & TRENDS
- There is no bullish divergence yet. RSI made a fresh low (20.6) with price on Nov 5, and MACD is making new lows. The indicators confirm price.
- The Oct 30 gap-down (-28.6%, $92.07 to $65.76) broke the $85–88 support shelf, which is also the SMA200D/EMA200 zone. The 200-day averages at about $86–87 are now resistance.
- EMA50 ($92.02) is converging on EMA200 ($85.67), and the gap closed from about $17 to $6 in 15 bars. SMA50D ($97.95) is converging on SMA200D ($87.04). A bearish EMA cross and a death cross are both likely within the coming weeks if price stays here.
- ADX and −DI have risen sharply since the gap, and +DI is at its lows.
- A relief bounce has begun (Nov 5 low $52.25 to $56.28), but it is small. Prior closes at $60.55 and $65.76 cap rallies.
CHART PATTERNS
- Bearish double top / lower-high structure (reference: Bearish Double Top): The chart shows a peak near $140 in June and a lower high near $125 in September. The neckline near $85–88 broke on the gap. The measured move (about $55 of height projected from the neckline) points toward the low $30s, which is a long-horizon target and unlikely to be fully reached in 83 days.
- No clean continuation pattern yet: The last few bars could develop into a small bearish flag or pennant (reference: Bearish Flag/Pennant) if the bounce stalls below $60–62. Failure there would resume the downtrend.
- Oversold bounce risk: A sharp one-bar gap crash with a volume climax can produce a base (reference: Bullish Double Bottom around $52). That needs confirmation, such as a higher low and a reclaim of $60.55 and then $65.76.
POTENTIAL SCENARIOS
- Scenario 1: Bearish Trend Continuation — Any relief bounce fades below the $60–66 gap/resistance zone and sellers retest the Nov 5 low. Death-cross dynamics and the broken double-top structure keep the downtrend intact. Trigger: Daily close below $52.25 (Nov 5 low), then below the lower BB near $50. Target: $46–50, with $52.50 as the base-case 83-day level. Invalidation: Daily close above $65.76 (Oct 30 close) with MACD histogram turning up. (45% probability)
- Scenario 2: Bullish Relief Rally / Basing — Capitulation volume marks an exhaustion low. RSI makes a higher low and price recovers toward the gap, filling part of it. Trigger: Close above $60.55 with CMF rising back toward 0. Target: $65–72, near the gap top and the 200-day averages as resistance. Invalidation: Close below $50. (33% probability)
- Scenario 3: Neutral Range Consolidation — Price chops between roughly $50 and $62 for weeks as the panic settles, while the moving averages continue to converge. Trigger: Several closes between $52 and $60 with ADX falling below 30. Target: $54–58. Invalidation: Close outside $50–$66. (22% probability)
PRICE TARGETS
- Target Price: $52.50 (83-day horizon, about 6.7% below current)
- Expected Range: $46.00 to $63.00 (width $17.00, about 30% of current price, which is at the upper end of the 61–180 day guidance because ATR is about 11% of price)
- Key Levels: Support at $52.25 (Nov 5 low, just under the $50.06 lower BB), Resistance at $60.55 (Nov 3 close; next at $65.76)
OVERALL BIAS
OVERALL BIAS: BEARISH - ADX is at 37.9 with −DI far above +DI, price sits below every moving average, MACD and CMF are deeply negative, and the double-top neckline has broken on heavy volume. The oversold RSI (25.7) argues for a bounce first, so conviction is modest and the expected path is choppy with a lower low.
This is educational analysis and not financial advice.