MU 83-day bearish forecast — Nov 8, 2026
- Bias: Bearish
- Timeframe: 83 days (made Nov 8, 2026, target date Jan 29, 2027)
- Price at analysis: $690.00
- Price target: $640.00
- Expected range: $555.00 – $760.00
- Result: Pending — graded after the close on Jan 29, 2027
Get a free AI analysis of MU today
Analysis
TECHNICAL INDICATORS
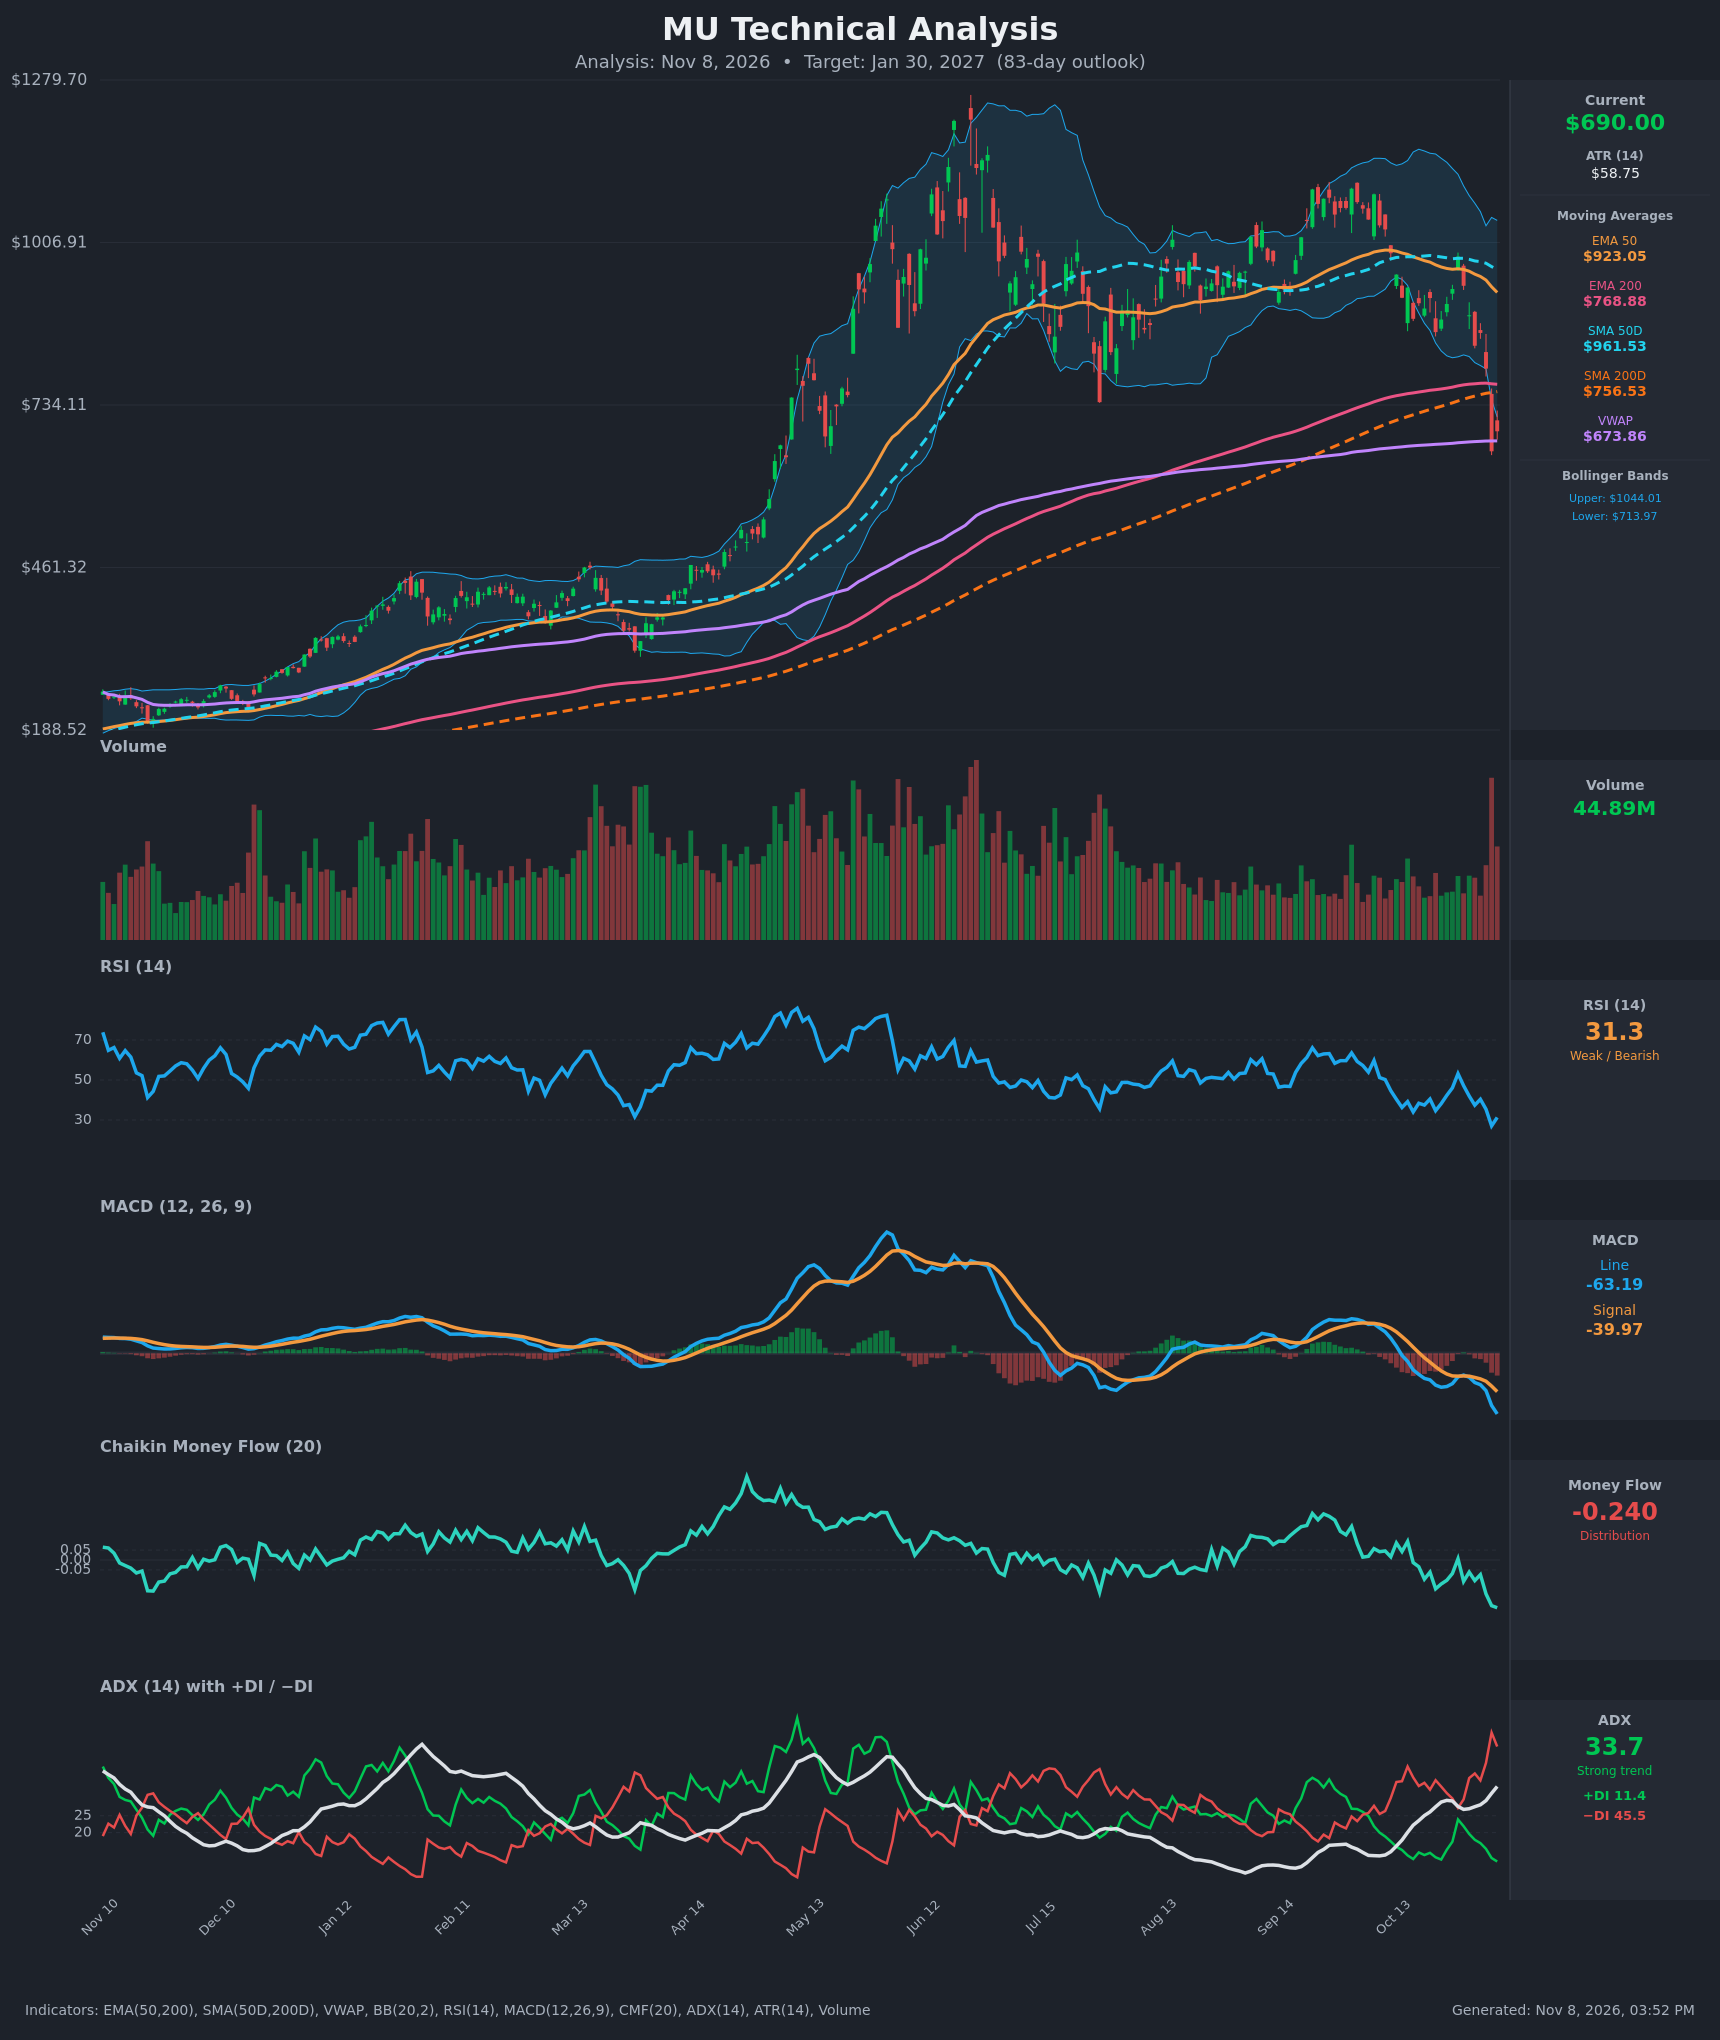
- RSI (14): 31.27, just off a 27.1 low on Nov 5 and sitting near the oversold line. The RSI downtrend is intact and the Nov 6 uptick is only a small bounce. Oversold readings in strong trends can persist. [Bearish]
- 20 EMA: Not supplied. Price at $690 is well below the EMA50 ($923.05), which is falling and acts as heavy overhead resistance. Price is also below the EMA200 ($768.88) and the SMA200D ($756.53), so both former supports are now resistance. [Bearish]
- MACD: Line -63.19 is below signal -39.97, a negative histogram of about -23 that is widening. The line is accelerating down to new lows, which means momentum is still expanding to the downside. [Bearish]
- Bollinger Bands (20): Upper $1044.01, lower $713.97. Price at $690 is below the lower band after a roughly 25% drop in two weeks. The bands are wide and the lower band is turning down. This is an oversold, "walking the band" setup that favors a relief bounce toward the mid-band at most, not a trend reversal. [Bearish]
- CMF (20): -0.240, deep distribution, far below -0.05. It has fallen steadily from near zero in late October and is making new lows, so selling pressure is heavy and persistent. [Distribution]
- ADX (14): 33.7 and rising from the 23-25 area. −DI is at 45.5 and +DI at 11.4, a very wide spread in favor of the bears. This is a strong downtrend that is still strengthening. [Strong Trend – Bearish]
- Volume: 44.89M on Nov 6, with a huge red spike on the Nov 5 breakdown. This is the heaviest volume in months, so the selloff has real distribution behind it. It could be capitulation, but it more likely confirms the break below the 200-day averages. [Bearish confirmation / possible capitulation]
DIVERGENCES & TRENDS
- There is no bullish RSI or MACD divergence. Both are making new lows with price, so the signals confirm the decline rather than warn against it.
- The RSI at 31 is above its 27.1 low, but price at $690 is above the $656.39 close, so this is only a minor bounce, not a divergence.
- Price fell from $983 (Oct 28) to $656 (Nov 5) while CMF and the DI spread kept deteriorating, so the trend is supported by money flow.
- Price has lost the EMA200 and SMA200D, both near $757-769. These are the last major long-term supports, and they were broken on heavy volume.
- A death cross has not yet occurred, since SMA50D ($961.53) is far above SMA200D ($756.53). The gap is closing quickly as the SMA50D rolls over.
- The EMA50 ($923) is falling and well above the EMA200 ($769). A bearish EMA cross is possible within the 83-day window if weakness persists.
- Price is slightly above VWAP ($673.86), which is the nearest support. The MACD bearish crossover is already confirmed.
CHART PATTERNS
- Bearish Head and Shoulders (loose): The chart shows a rally to a peak near $1250 in June (head), with lower highs around $1000 before and after. The neckline is near $730-750, which is the July/August swing lows, and price has now broken below it on heavy volume. The full measured move is large and unrealistic in 83 days. A partial move toward the $550-640 area is a reasonable expectation.
- Failed consolidation / broad top: The June to October range ($730-$1000+) has broken to the downside, which is a bearish resolution.
- Retest risk: A bounce to the broken neckline and 200-day averages ($735-770) is a common behavior after such breaks. If that area is rejected, it confirms the pattern.
POTENTIAL SCENARIOS
- Scenario 1: Bearish Continuation After Relief Bounce — Price bounces toward the broken 200-day averages and the lower Bollinger Band, then fails and rolls over as ADX, −DI and CMF stay bearish. Trigger: rejection at $735-$770 or a close below VWAP and the $656 low. Target: $600-$640, with an extension to $560 if the $650 support gives way. Invalidation: a daily close above $770 (EMA200) that holds. (50% probability)
- Scenario 2: Bullish Capitulation Reversal — The huge volume proves to be a washout. RSI holds above 27-30, and price reclaims the SMA200D and EMA200 and rebuilds toward the mid-range. Trigger: a close above $757-$770 with CMF turning toward zero and MACD curling up. Target: $800-$850. Invalidation: a close back below $650. (30% probability)
- Scenario 3: Neutral Base Building — Price chops between $650 and $760 for weeks as the selling exhausts. Trigger: repeated holds of $650-$674 with falling ADX. Target: $690-$720. Invalidation: a break of either boundary on volume. (20% probability)
PRICE TARGETS
For the 83-day horizon (to about Jan 30, 2027):
- Target Price: $640.00
- Expected Range: $555.00 to $760.00 (width $205, about 29.7% of the current price, in line with the 61-180 day guidance)
- Key Levels: Support at $656.39 (the Nov 5 low, with VWAP at $673.86 just above), Resistance at $756.53 (SMA200D, with EMA200 at $768.88 just above)
OVERALL BIAS
OVERALL BIAS: BEARISH - Price has broken below both 200-day averages on heavy volume. MACD is below signal and accelerating down, CMF is at -0.24, and ADX is 33.7 with −DI at 45.5 against +DI at 11.4. An oversold bounce toward $735-$770 is likely, but the dominant trend and rejection risk at the broken averages favor a lower target near $640.
This is educational analysis and not financial advice.