USO 83-day bearish forecast — Nov 8, 2026
- Bias: Bearish
- Timeframe: 83 days (made Nov 8, 2026, target date Jan 29, 2027)
- Price at analysis: $148.41
- Price target: $138.00
- Expected range: $121.00 – $157.00
- Result: Pending — graded after the close on Jan 29, 2027
Get a free AI analysis of USO today
Analysis
TECHNICAL INDICATORS
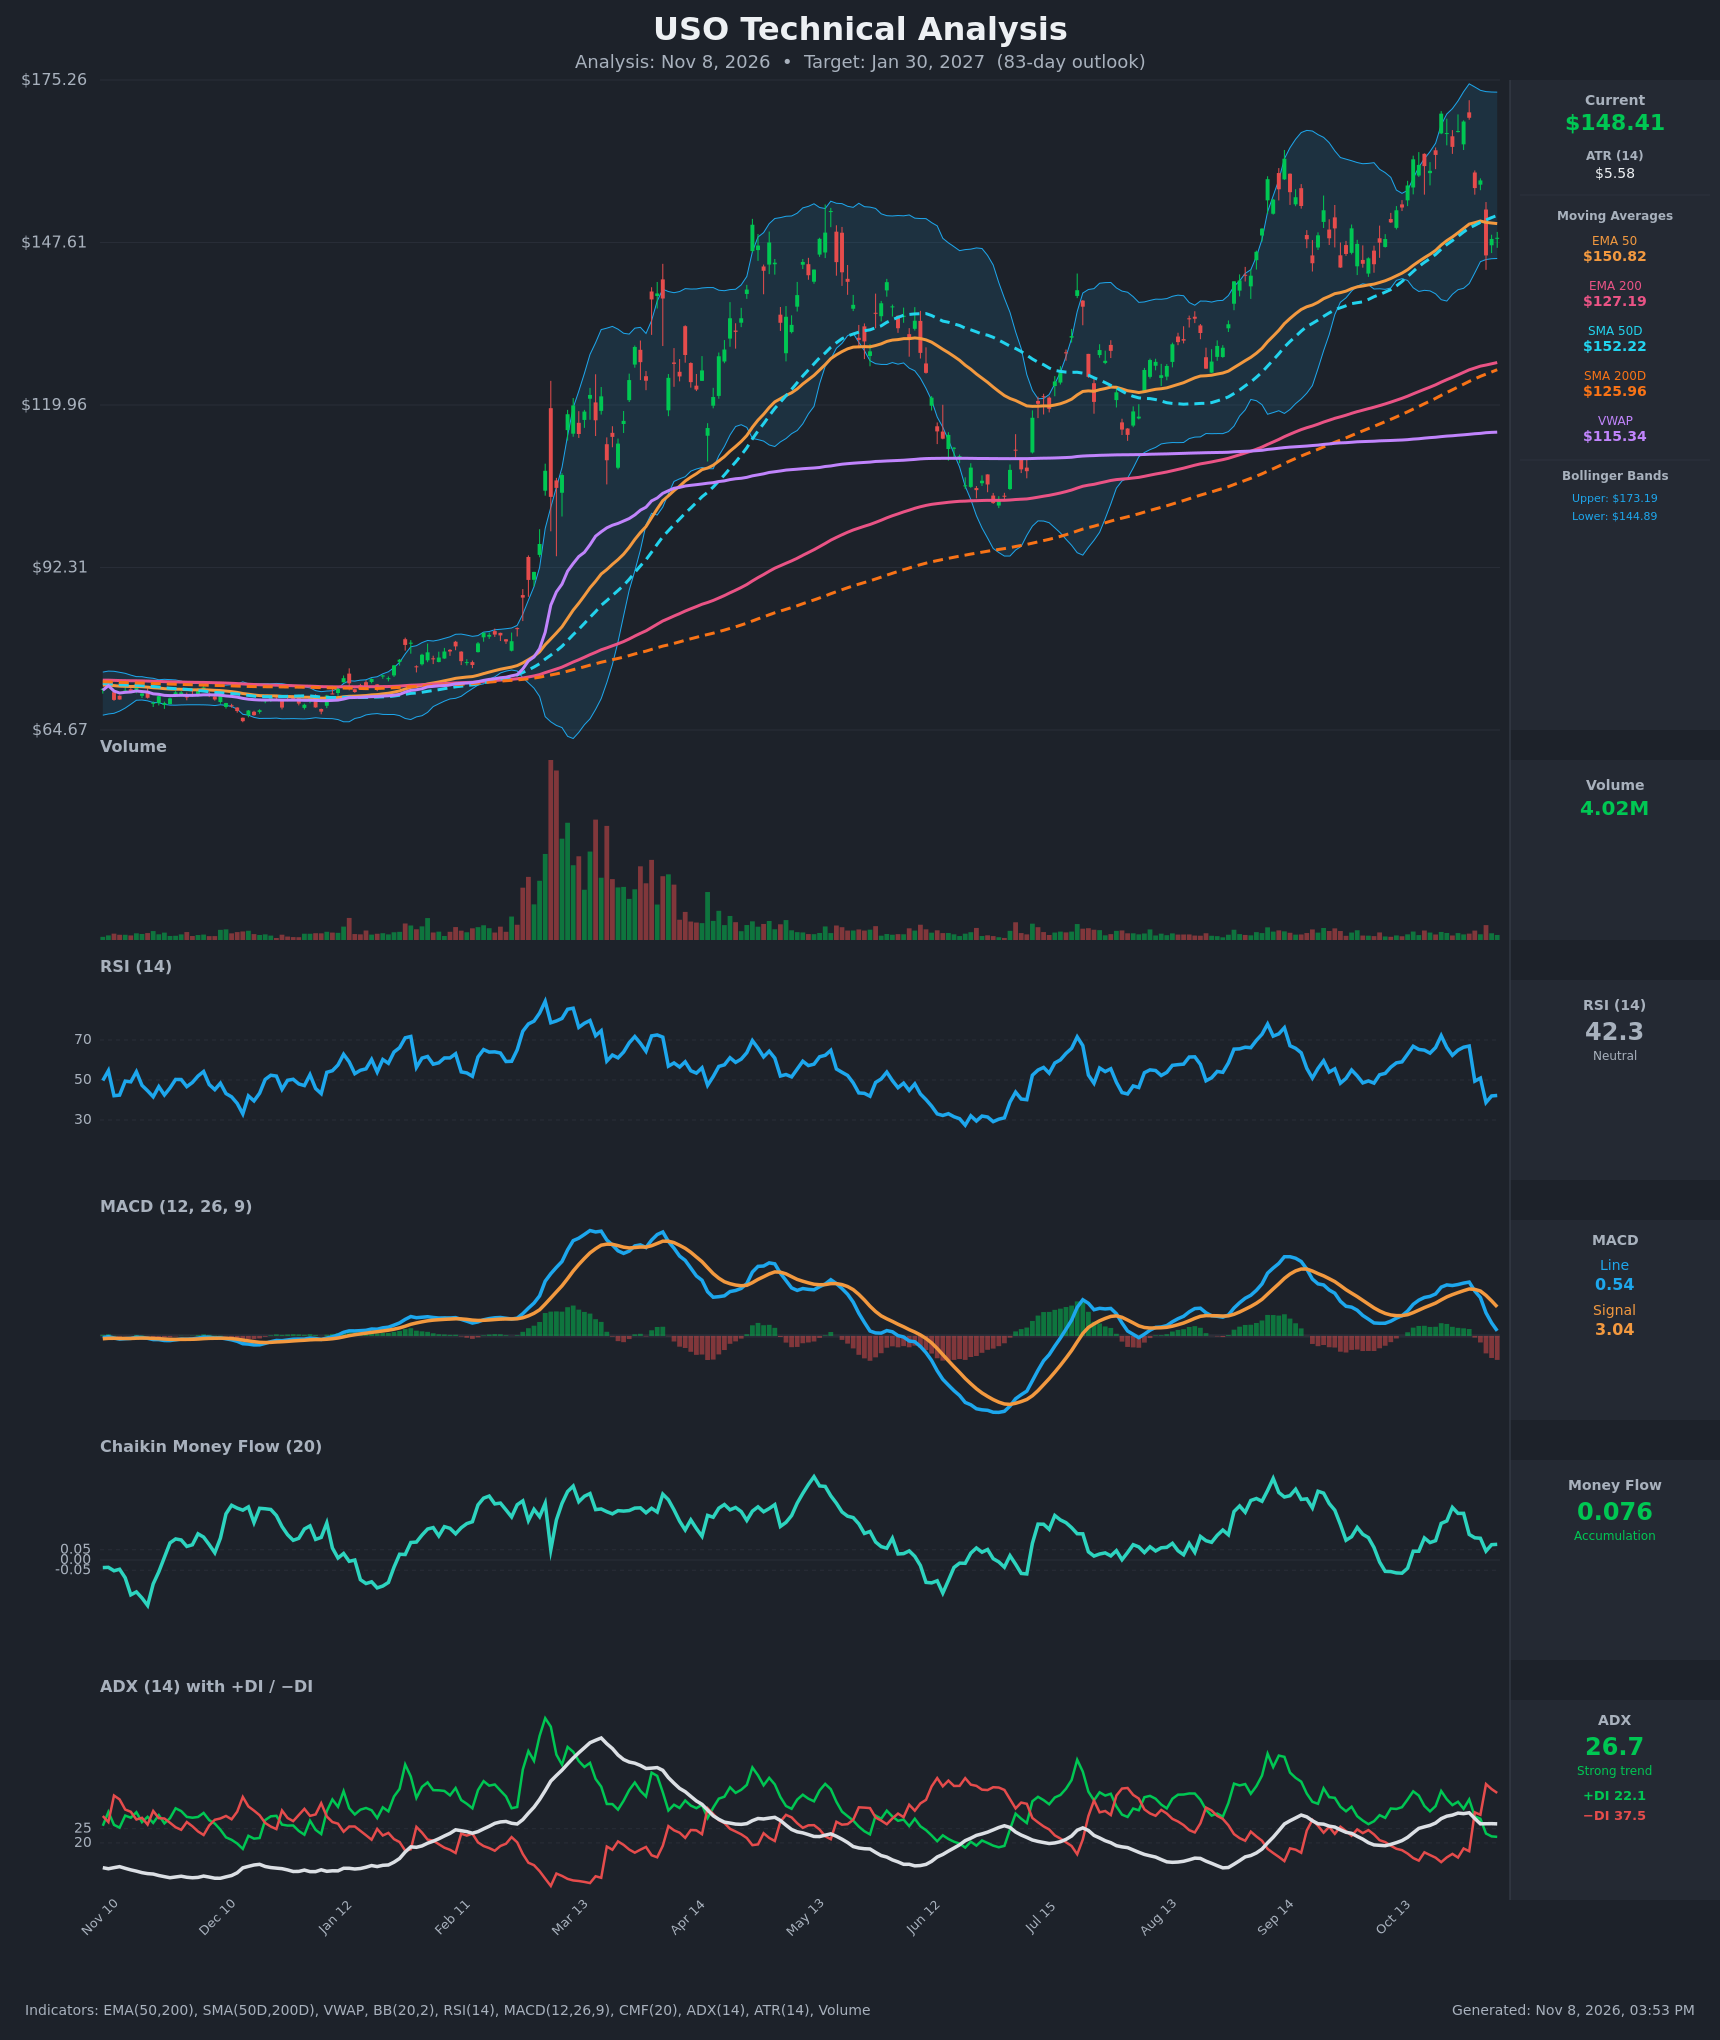
- RSI (14): 42.27, down from 67 on Oct 30 and a low of 38.8 on Nov 4. It has dropped through 50 and is only bouncing weakly, so it is in bearish-leaning momentum territory, not oversold. [Bearish]
- 20 EMA: No 20 EMA value was supplied. The EMA 50 ($150.82) and SMA 50D ($152.22) both sit just above price, so the short-term moving averages act as overhead resistance after the Nov 2–4 breakdown. [Bearish]
- MACD: Line 0.536 versus signal 3.044. The bearish crossover happened around Nov 2. The line has fallen from 5.64 to 0.54 and the histogram is deeply negative and expanding, so momentum is still deteriorating. [Bearish]
- Bollinger Bands (20): Upper $173.19 and lower $144.89. Price at $148.41 is in the lower part of the band, about $3.50 above the lower band, after the rejection near the upper band on Oct 23 and Oct 30. A band-walk down or a bounce off $144.89 are both possible, but the mid-band (~$159) is now far overhead. [Neutral]
- CMF (20): 0.076, still above the +0.05 threshold, but it has faded from 0.256 on Oct 27. Money flow remains mildly positive while price has dropped, so the selling has not yet shown up as clear distribution. [Accumulation]
- ADX (14): 26.7 with −DI (37.5) well above +DI (22.1). The DI cross occurred Nov 2 and the spread is widening, so this is an established trend with the bears in control. [Strong Trend – Bearish]
- Volume: 4.02M is average to modest. The recent red candles (Nov 2, Nov 4) show decent participation, but there is no capitulation spike, so there is no sign of exhaustion yet. [Neutral to mildly bearish]
DIVERGENCES & TRENDS
- Long-term trend: Price is well above the rising EMA 200 ($127.19) and SMA 200D ($125.96), and EMA 50 and SMA 50D are above both. The golden-cross structure is intact, so the primary trend is still up.
- Short-term trend: Price lost the EMA 50 and SMA 50D on Nov 4 (close $145.41), and the SMA 50D is now above price at $152.22. This is a short-term trend shift to the downside inside a longer uptrend.
- Momentum: The MACD bearish crossover, RSI falling through 50, and the −DI/+DI flip all confirm the pullback. RSI peaked at 72 on Oct 23 on a new high, but momentum has not confirmed the highs near $169 since.
- CMF: It is positive but fading while price falls. This is the one meaningful bullish counterpoint, since it suggests dip buying and may limit the depth of the pullback.
- VWAP: Price is far above VWAP ($115.34), so the stock is extended relative to volume-weighted cost. That leaves room for mean reversion toward the $125–$135 area if selling continues.
CHART PATTERNS
- Bearish Double Top: Peaks at ~$169.5 (Oct 23) and ~$168.8 (Oct 30), with the neckline around $145–$146 (the Nov 4 low of $145.41). Price is sitting right on the neckline now. A close below ~$144.89 (the lower Bollinger band) would confirm the pattern. The measured move is about $24 (peak ~$169 minus neckline ~$145), pointing to roughly $121.
- Alternative reading (Bullish Flag / Ascending Triangle): In the larger uptrend, the pullback could be a bull flag or a retest of the EMA 50 zone. This would be validated only by a reclaim of $152–$153.
- Prior behavior: In June–July, a similar rejection from ~$130 led to a deep pullback toward the $100 area before recovery. This suggests corrections in this stock can extend well below the 50-day averages.
POTENTIAL SCENARIOS
- Scenario 1: Bearish Double-Top Breakdown — The neckline at ~$145 fails and price continues the correction toward the rising 200-day averages. Trigger: daily close below $144.89 on rising volume. Target: $138 first, then $127–$130 (EMA 200/SMA 200D zone), with an extreme measured move near $121. Invalidation: daily close above $153 (reclaiming EMA 50/SMA 50D). (52% probability)
- Scenario 2: Bullish Dip-Buy and Trend Resumption — CMF accumulation holds, the lower band and $145 act as support, and price reclaims the 50-day averages. Trigger: close above $152.22 with MACD histogram turning up. Target: $160–$165, then a retest of $169–$173. Invalidation: close below $144 on strong volume. (30% probability)
- Scenario 3: Neutral Choppy Consolidation — Price ranges between the lower band and the 50-day averages while momentum resets. Trigger: failure of both the $145 break and the $152 reclaim. Target: $142–$155 range. Invalidation: decisive close outside that range. (18% probability)
PRICE TARGETS
Timeframe: 83 days (Jan 30, 2027). The 61–180 day guidance is ~18–30% width, so I used ~24%.
- Target Price: $138.00
- Expected Range: $121.00 to $157.00 (width $36.00 ≈ 24.3% of the current price)
- Key Levels: Support at $144.89 (lower Bollinger band/neckline area), with deeper support at $127.19 (EMA 200). Resistance at $152.22 (SMA 50D), then $169.50.
OVERALL BIAS
OVERALL BIAS: BEARISH - A bearish MACD crossover, −DI dominating with ADX above 25, price below the 50-day averages, and a potential double top at the $145 neckline outweigh the still-positive CMF and the intact long-term uptrend. The more likely path is a correction toward the $127–$138 area.
This is educational analysis and not financial advice.