ASTS 97-day bearish forecast — Nov 8, 2026
- Bias: Bearish
- Timeframe: 97 days (made Nov 8, 2026, target date Feb 12, 2027)
- Price at analysis: $32.33
- Price target: $28.00
- Expected range: $23.50 – $32.00
- Result: Pending — graded after the close on Feb 12, 2027
Get a free AI analysis of ASTS today
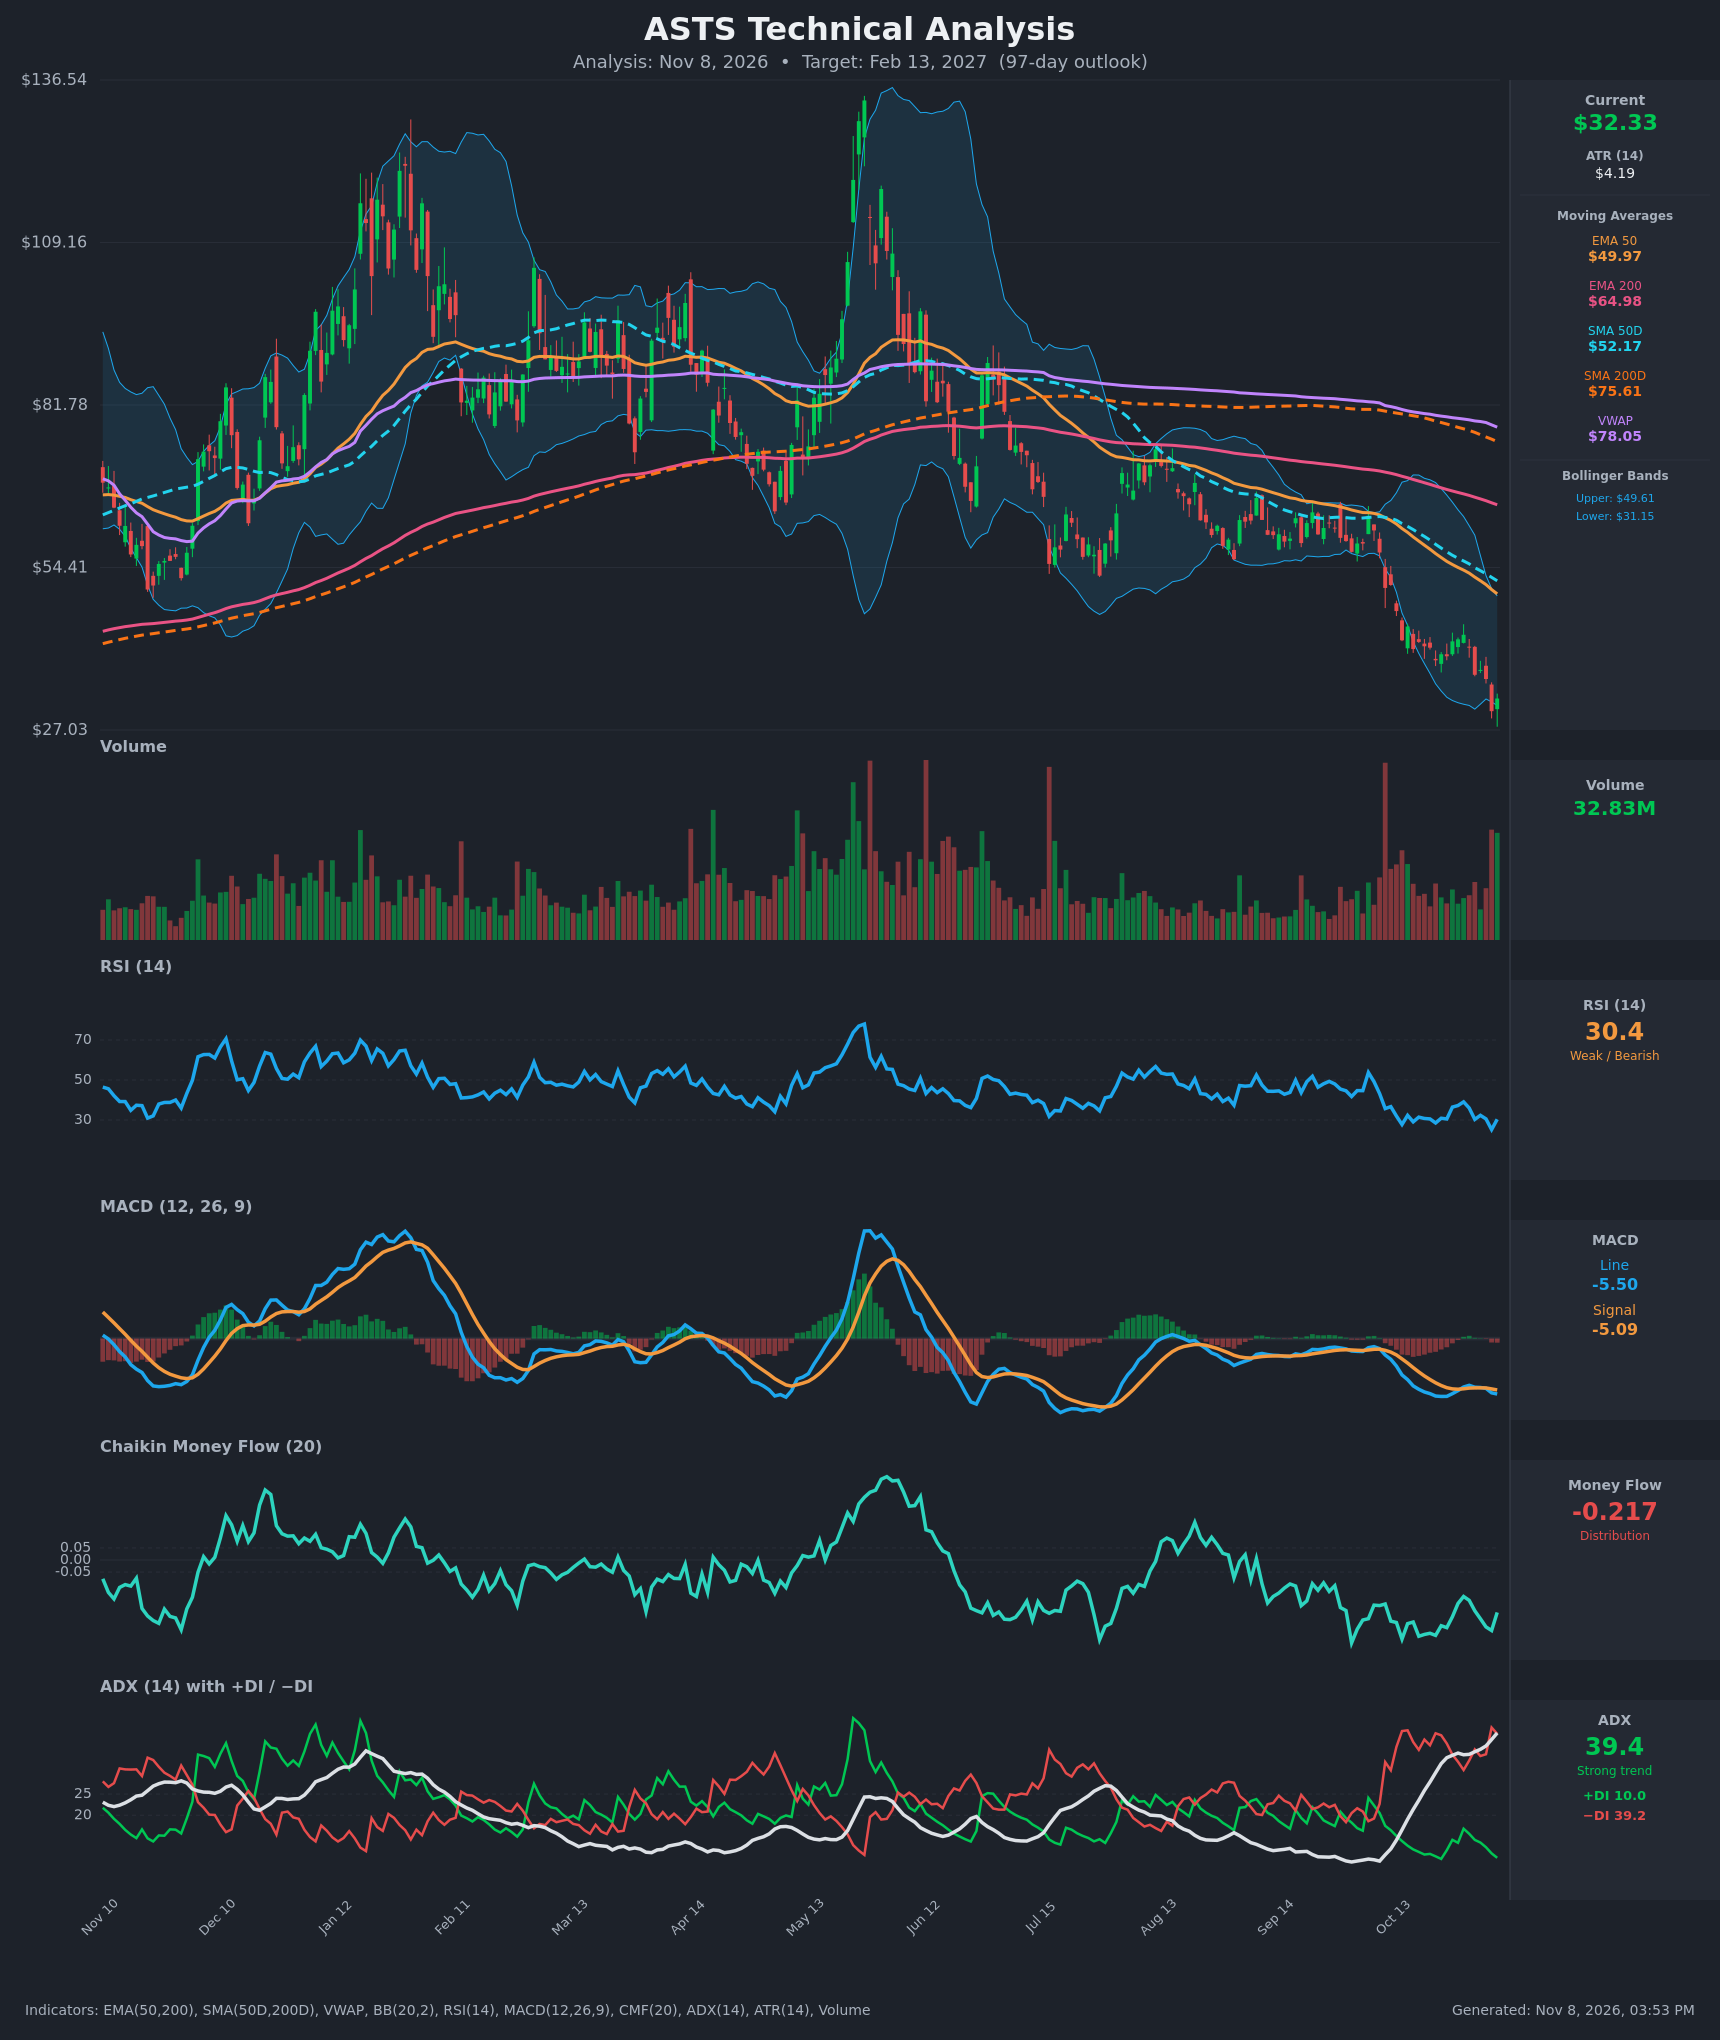
Analysis
TECHNICAL INDICATORS
- RSI (14): 30.36, right at the oversold threshold. It hit 25.2 on Nov 5 and bounced with the 32.33 close. RSI has stayed in the 25-40 band since mid-October with no move back above 50, which is a bear-trend profile. Oversold favors a relief bounce, not a reversal. [Bearish]
- 20 EMA: Not supplied. Using the EMA 50 ($49.97) as the proxy, price is about 35% below it, and the EMA 50 is falling and now below the EMA 200 ($64.98). Overhead moving averages are acting as resistance. [Bearish]
- MACD: Line -5.495 is below signal -5.090, with a histogram of about -0.40. The line crossed below the signal on Nov 2 and the gap has widened since. Both lines are deeply negative and re-diverging after a brief flattening. [Bearish]
- Bollinger Bands (20): Upper $49.61, lower $31.15. Price at $32.33 is hugging the lower band after a close below it on Nov 5 ($30.20). The bands are expanding downward, so this is a "walking the band" trend move, not a squeeze. A bounce to the midline (~$40) is possible, but band walks tend to persist in strong trends. [Bearish]
- CMF (20): -0.217, well below -0.05 and negative for the whole last 15 bars (-0.15 to -0.32). Sustained distribution with no accumulation. [Distribution]
- ADX (14): 39.4 and rising, with −DI (39.2) far above +DI (10.0). That is a strong, accelerating downtrend with bears firmly in control. An ADX near 40 can also mark a late-stage trend, but there is no DI crossover to signal a turn. [Strong Trend – Bearish]
- Volume: 32.83M on the latest bar, one of the heaviest recent prints. The last bar is green after the Nov 5 flush. Heavy volume near the lows could mean partial capitulation, but price has not yet reclaimed any resistance. [Possible capitulation, unconfirmed – cautiously Neutral/Bearish]
DIVERGENCES & TRENDS
- No clear bullish divergence. RSI made a lower low (25.2) as price made a lower low ($30.20), so momentum confirms the price weakness.
- Moving average structure is fully bearish. EMA 50 ($49.97) is below EMA 200 ($64.98), and SMA 50D ($52.17) is below SMA 200D ($75.61), which is a death cross. Price is below all of them and 57% below VWAP ($78.05).
- The downtrend is accelerating. The stock has fallen from about $65 in the summer to $32, with a break of the late-summer base near $60. Lower highs ($43 on Oct 29 and $41.96 on Oct 27) are in place.
- The MACD bearish crossover (Nov 2) is intact. The Oct 30-Nov 2 attempt to turn up failed.
- ADX rose from under 20 in early October to 39.4 as −DI surged, which is a trend-initiation signature.
- CMF has stayed negative for months with only brief rebounds, so there is no sign of accumulation.
CHART PATTERNS
- Bearish Flag / Pennant (continuation): The tight consolidation between roughly $39 and $43 from Oct 22 to Oct 30 broke down on Nov 2 and Nov 5. The flagpole is the drop from about $54 to $39. A measured move of about $15 from the breakdown near $39 points to the mid/low $20s.
- Broader descending channel / lower highs and lower lows: This resembles the Descending Triangle and Bearish Rising Wedge family in that the trend resumed lower. No bullish reversal pattern (double bottom, inverted H&S, falling wedge) has confirmed yet.
- Bullish counter-case: A possible Bullish Falling Wedge or double bottom would require a higher low above ~$30 and a reclaim of $37-$40. Neither is confirmed.
- Targets: The flag measured move implies about $24-$26. A relief rally would likely stall at $37-$41, which is the broken flag base and the Bollinger midline.
POTENTIAL SCENARIOS
- Scenario 1: Bearish Trend Continuation — The downtrend persists with bounces failing below the $37-$41 flag/breakdown zone, and price grinds lower with −DI still dominant. Trigger: a daily close below the Nov 5 low zone ($27-$30), or a rejection at $37-$40 on a relief bounce. Target: $24-$28, with a measured-move extension to the low $20s. Invalidation: a daily close above $41.96 with RSI above 50 and +DI crossing above −DI. (52% probability)
- Scenario 2: Bullish Oversold Relief Rally — Capitulation volume and an RSI of 25-30 spark a mean-reversion bounce toward the Bollinger midline. Trigger: a close above $37.15 and then $40 with improving CMF. Target: $40-$44 (the 20-day mean and the Oct 27-29 highs). Invalidation: a close back below $30.20. (33% probability)
- Scenario 3: Neutral Basing Range — Price stabilizes between about $27 and $37 as ADX cools from its extreme and volume dries up. Trigger: repeated holds above $28-$30 with no break of $37. Target: $30-$35. Invalidation: a break outside the $27-$37 range on rising volume. (15% probability)
PRICE TARGETS
- Target Price: $28.00 (97-day horizon, about 13% below current)
- Expected Range: $23.50 to $32.00 (width $8.50, about 26% of current price, consistent with the 18-30% guidance for 61-180 days)
- Key Levels: Support at $27.03, Resistance at $40.00
OVERALL BIAS
OVERALL BIAS: BEARISH - ADX near 40 with −DI at 39 versus +DI at 10, a MACD bearish crossover, persistent distribution (CMF -0.217), and a full death-cross structure with price below every moving average. The oversold RSI and the stock's position at the lower Bollinger Band argue for a relief bounce toward $37-$41, but the trend favors lower prices over 97 days.
This is educational analysis and not financial advice.