INTC 97-day bearish forecast — Nov 8, 2026
- Bias: Bearish
- Timeframe: 97 days (made Nov 8, 2026, target date Feb 12, 2027)
- Price at analysis: $56.28
- Price target: $51.50
- Expected range: $45.00 – $61.50
- Result: Pending — graded after the close on Feb 12, 2027
Get a free AI analysis of INTC today
Analysis
TECHNICAL INDICATORS
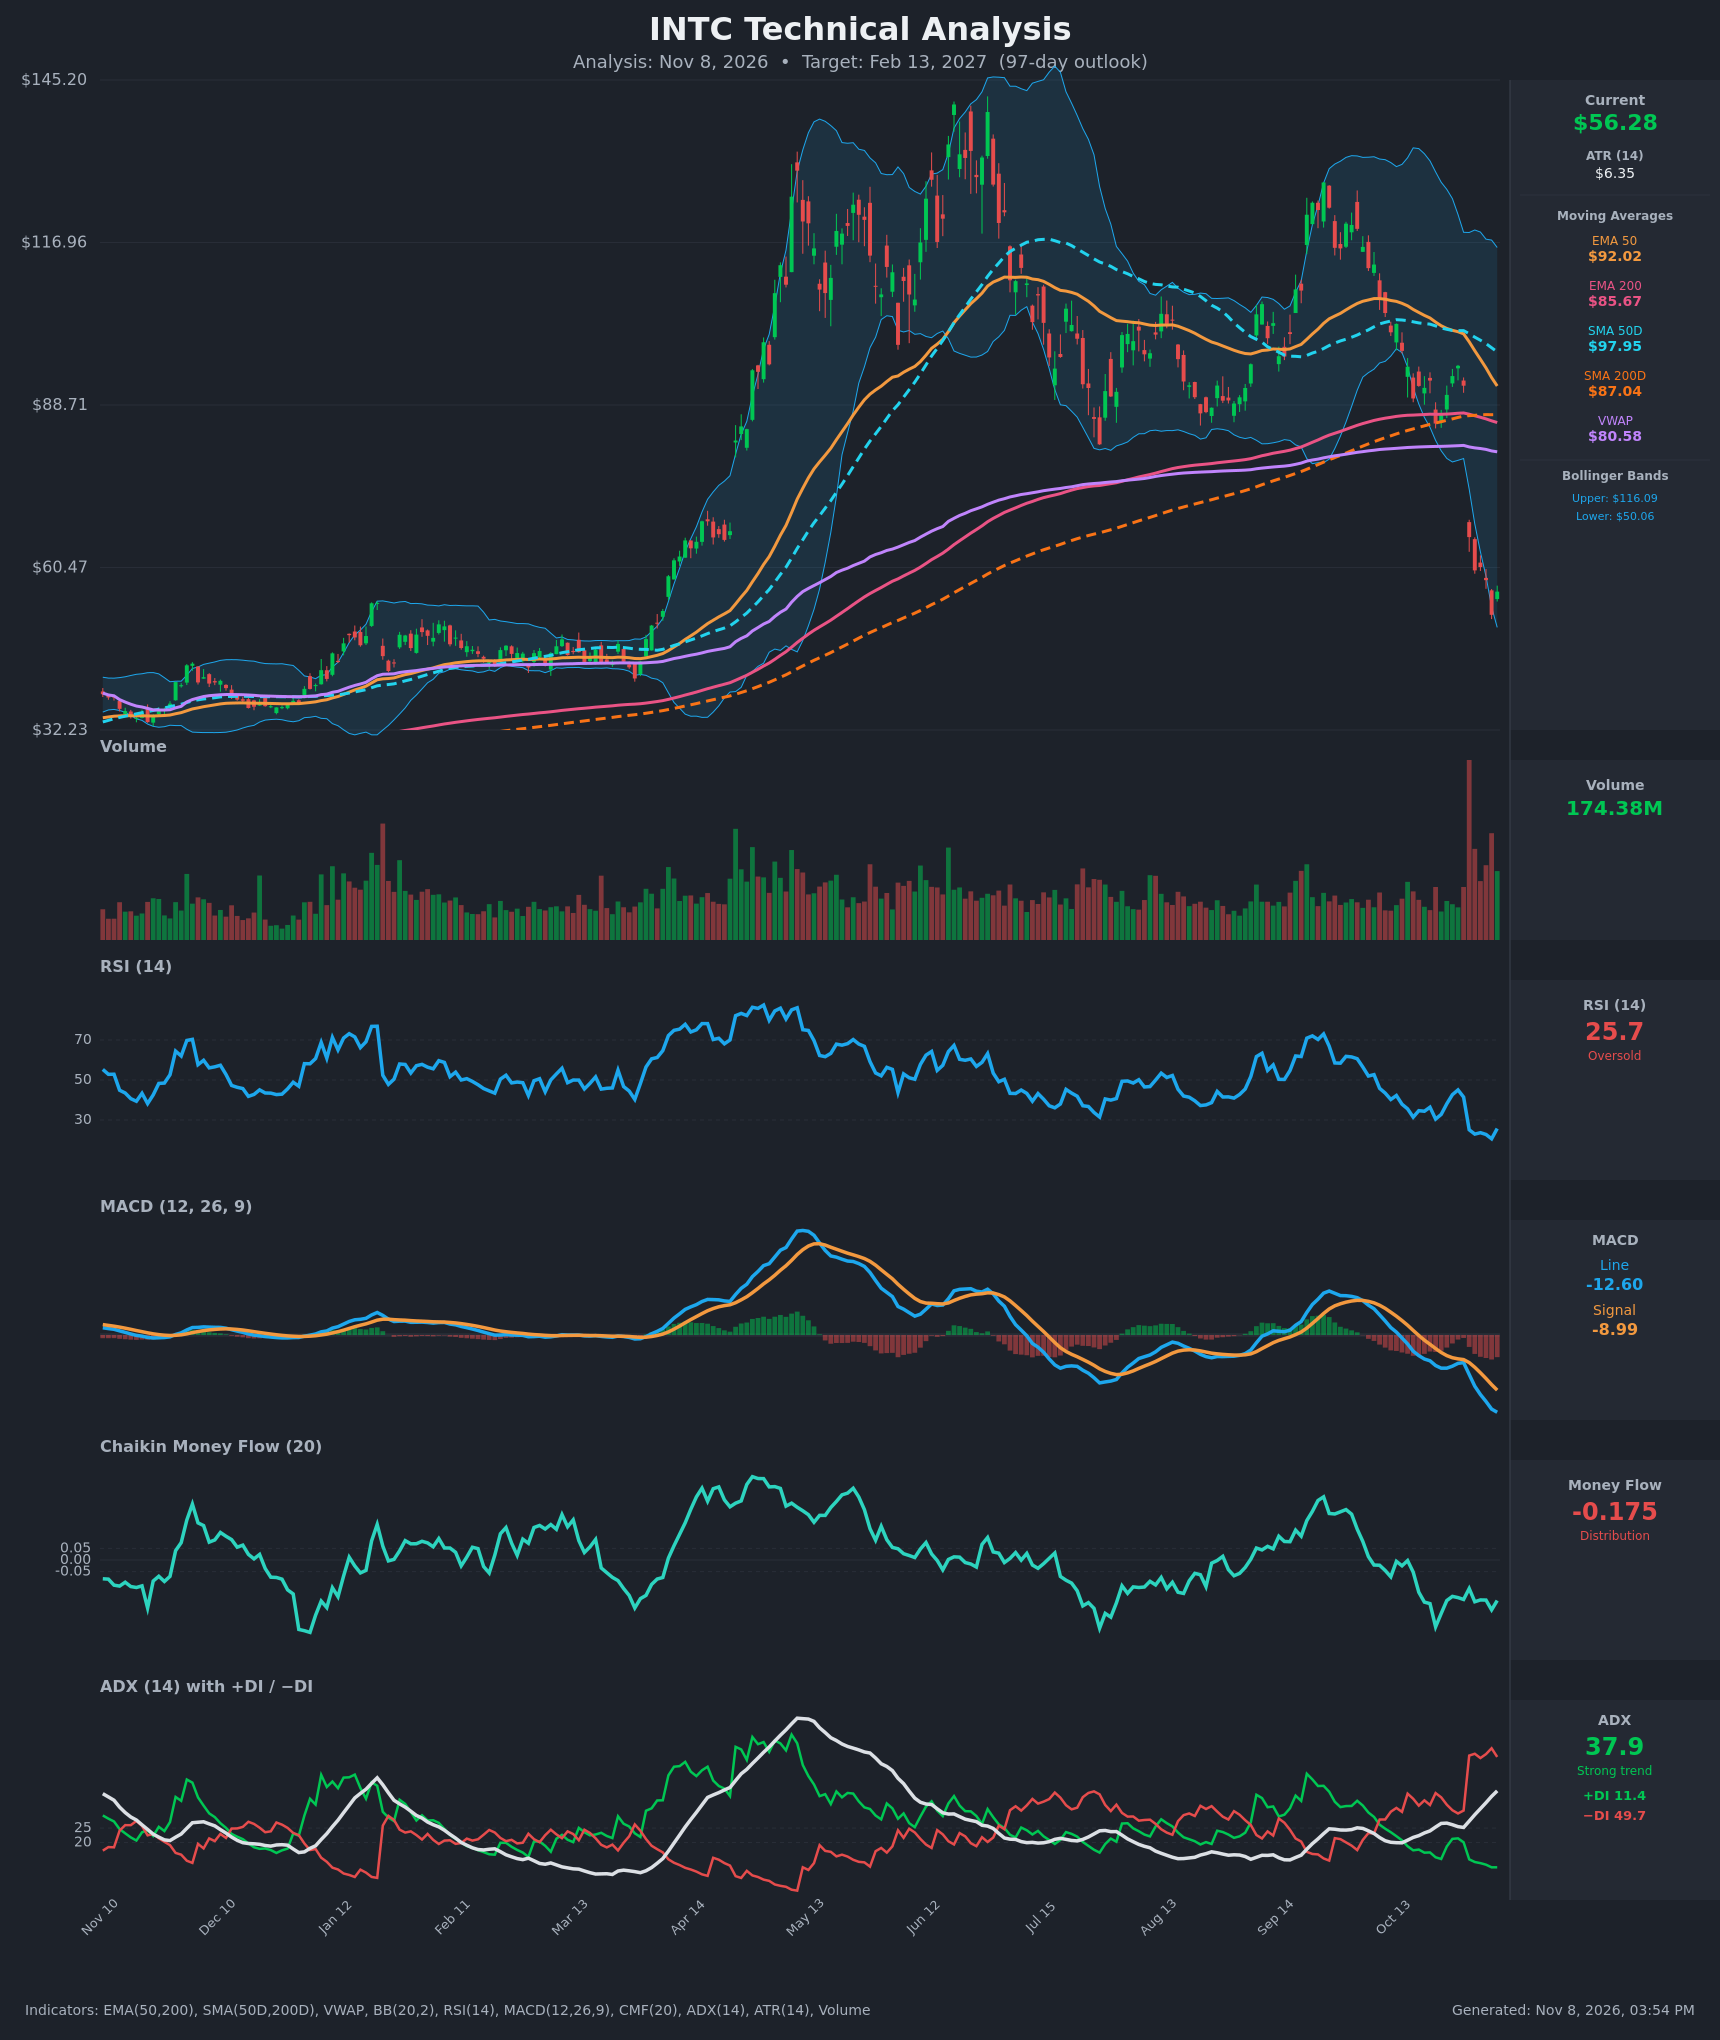
- RSI (14): 25.72, oversold. It bottomed at 20.6 on Nov 5 and ticked up to 25.7 on the last bar. This is a bounce attempt, but RSI is still far below 30, and it fell from 45 to 25 in a week. [Bearish]
- 20 EMA: No 20 EMA was supplied, so the EMA 50 is used instead. EMA 50 is $92.02, falling about $1.5 per day, and price is 39% below it. EMA 50 is also converging on EMA 200 ($85.67), and a bearish EMA cross is likely within days. Price is below EMA 50, EMA 200 and SMA 200D ($87.04), so all of them act as resistance. VWAP at $80.58 is also well overhead. [Bearish]
- MACD: Line -12.60 is below signal -8.99, and the gap is widening (histogram about -3.6 and growing more negative). There is no sign of a bullish cross or histogram bottoming. [Bearish]
- Bollinger Bands (20): Bands are $50.06 to $116.09, very wide after the Oct 30 gap. Price at $56.28 is in the lower fifth of the band after pressing the lower band, which is an oversold, stretched condition. Walking the lower band in a strong trend is bearish, but a mean-reversion bounce is possible. [Bearish]
- CMF (20): -0.175, well below -0.05 and negative for the whole decline. Sellers are dominant and there is no accumulation yet. [Distribution]
- ADX (14): 37.9 and rising, with −DI (49.7) far above +DI (11.4). This is a strong, well-established downtrend. ADX has not peaked, so trend strength is still increasing. [Strong Trend – Bearish]
- Volume: 174.38M on the latest bar, with a huge spike on the Oct 30 gap-down and elevated volume since. That looks like a capitulation or earnings-shock event. The bounce day has high volume, which is a mild stabilization clue, but a single bounce does not confirm a bottom. [Heavy distribution / possible capitulation]
DIVERGENCES & TRENDS
- No bullish divergence yet. RSI made a new low (20.6) with price on Nov 5, and MACD is still making new lows. Momentum confirms the price drop.
- Moving averages: EMA 50 is converging on EMA 200 ($92.02 vs $85.67), so a bearish EMA cross is likely within days. SMA 50D ($97.95) is also falling toward SMA 200D ($87.04), so a death cross is likely in the coming weeks. Price is about 35% below SMA 200D, which is a major long-term breakdown.
- Trend reversal: Price went from around $145 in the early peak to $92, then gapped to $65.76 on Oct 30, lost the entire move above $60, and printed a low of $52.25. The sequence is lower highs and lower lows.
- DI and CMF: −DI crossed above +DI and has stayed dominant. CMF has been negative for weeks.
- Counterpoint: Extreme distance from the averages and oversold RSI raise the odds of a relief rally, probably toward $60 to $66 (the gap-fill zone).
CHART PATTERNS
- The dominant structure is a breakdown gap from the lower range ($85 to $95) into a new low zone. After the drop, the small range at $58 to $60 looks like a Bearish Flag/Pennant continuation from the reference diagram.
- Measured-move target: A flag after a $26 drop (about $92 to $66), then a second leg, implies downside toward the mid-$50s to $50 area, which coincides with the lower Bollinger Band ($50.06) and the $52.25 low.
- Alternative: If price holds $52 to $50 and builds a base with higher lows, it could become a Double Bottom (reference diagram). Confirmation would require a break above about $60.55 and then $65.76.
POTENTIAL SCENARIOS
- Scenario 1: Bearish Trend Continuation — Price rallies weakly into the $58 to $61 area, fails below the $65.76 gap, and resumes the downtrend, helped by an EMA death cross and negative CMF. Trigger: a close below $52.25 (the Nov 5 low). Target: $50 to $46, with $51.50 as the central 97-day estimate. Invalidation: a weekly close above $65.76. (45% probability)
- Scenario 2: Bullish Oversold Relief Rally — Capitulation volume and oversold RSI lead to a mean-reversion bounce and a base. Price recovers part of the gap. Trigger: a close above $60.55, then $65.76, with RSI back above 40 and MACD histogram improving. Target: $66 to $75. Invalidation: a close below $50. (38% probability)
- Scenario 3: Neutral Basing Range — Price chops between about $50 and $62 as selling exhausts but buyers lack conviction. Trigger: sideways closes between $52 and $60 with ADX falling. Target: $54 to $59. Invalidation: a decisive break of $50 or $65. (17% probability)
PRICE TARGETS
- Target Price: $51.50 (97-day horizon)
- Expected Range: $45.00 to $61.50. Width is $16.50, about 29% of current price, which is in line with the 61-180 day guidance (18-30%).
- Key Levels: Support at $52.25 (Nov 5 low; $50.06 lower Bollinger Band below that), Resistance at $60.55
OVERALL BIAS
OVERALL BIAS: BEARISH - Price is in a strong downtrend (ADX 37.9, −DI 49.7 vs +DI 11.4). MACD is falling further below its signal, CMF is at -0.175, and price is far below every moving average, with an EMA death cross imminent. Oversold RSI makes a relief bounce likely, but with no confirmed base or divergence, the more probable 97-day outcome is a lower price near $51.50.
This is educational analysis and not financial advice.