META 97-day bearish forecast — Nov 8, 2026
- Bias: Bearish
- Timeframe: 97 days (made Nov 8, 2026, target date Feb 12, 2027)
- Price at analysis: $610.15
- Price target: $585.00
- Expected range: $520.00 – $660.00
- Result: Pending — graded after the close on Feb 12, 2027
Get a free AI analysis of META today
Analysis
TECHNICAL INDICATORS
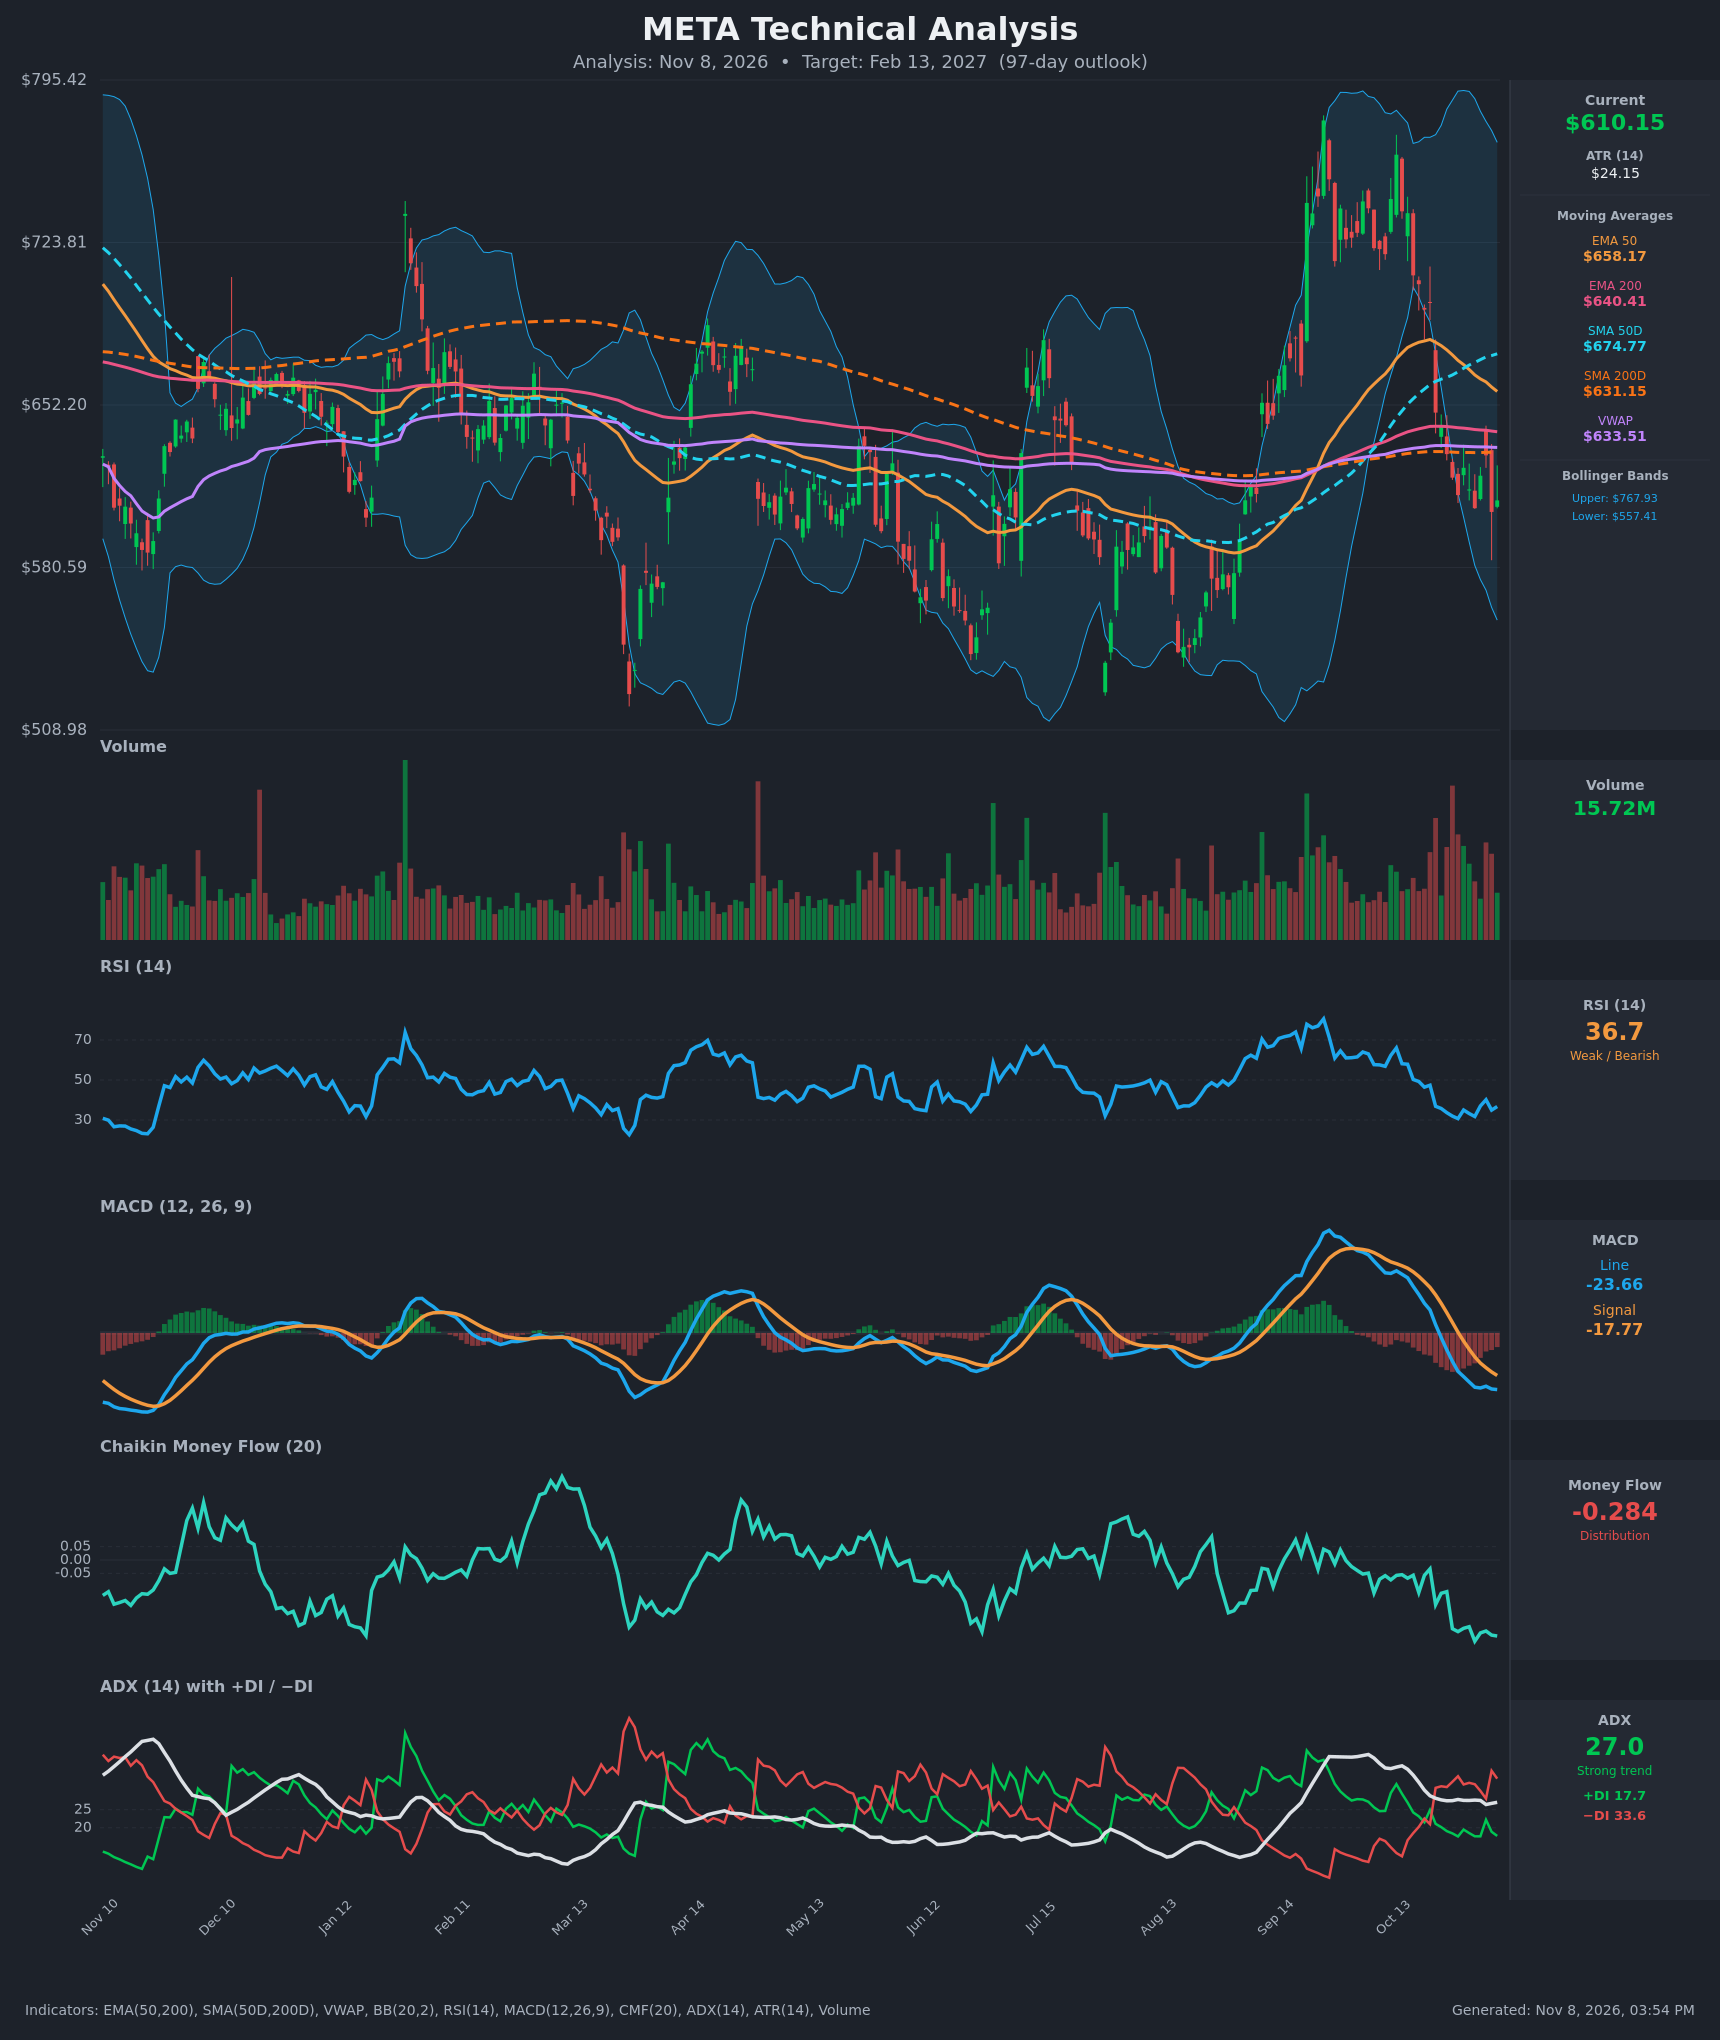
- RSI (14): 36.74, down from about 49 on Oct 19 and near the 30.7 low on Oct 28. Momentum is weak and sits just above oversold. The bounces to 35-40 have kept failing, and there is no bullish divergence yet. [Bearish]
- 20 EMA: No 20 EMA value was provided, so I use the EMA 50 at $658.17 as the nearest dynamic reference. Price at $610.15 is about 7% below it, and the EMA is falling (from $680 to $658 in 15 bars). It acts as overhead resistance. [Bearish]
- MACD: Line -23.66 is below Signal -17.77, and the histogram is negative and widening. The bearish crossover came on Oct 28. Both lines are well below zero and still falling, so momentum is still deteriorating. [Bearish]
- Bollinger Bands (20): The bands run from $557.41 to $767.93, with a midline near $662. Price sits in the lower quarter, about $53 above the lower band. The bands are very wide after the September spike but are now contracting. Price is stretched below the mean, which could mean a bounce, but a "walk" down the lower half is more likely. [Bearish]
- CMF (20): -0.284 is deep in distribution, near the worst readings of the past year and well below -0.05. It has stayed negative for the whole 15-bar window. Selling pressure is persistent. [Distribution]
- ADX (14): 27.0, above 25, so the trend is strong, though it has been flattening. −DI at 33.6 is well above +DI at 17.7, so bears control. [Strong Trend - Bearish]
- Volume: 15.72M, which is moderate. The recent sell-off days (Oct 22, early Nov) carried heavier red-bar volume than the bounces. [Bearish - selling volume dominates]
Moving averages and VWAP:
- Price is below the EMA 50 ($658.17), EMA 200 ($640.41), SMA 200D ($631.15) and VWAP ($633.51). Every one of these is overhead resistance.
- The EMA 50 is converging on the EMA 200 (gap of about $18 and closing), so a bearish EMA cross looks likely within a few weeks.
- The SMA 50D ($674.77) is still above the SMA 200D ($631.15). It is rolling over, but no death cross has occurred yet.
DIVERGENCES & TRENDS
- There is no bullish divergence. Price is making lower lows (Oct 28 $612, Nov 2 $607, Nov 5 $605) and RSI is making similar lows around 31-35, so the two are confirming each other.
- MACD and CMF are both making new lows for the move. CMF at -0.28 is a notable distribution signal.
- Crossovers and breaks:
- MACD crossed below its signal on Oct 28 (bearish).
- −DI crossed above +DI on Oct 22 and has stayed there.
- Price lost the SMA 200D, EMA 200 and VWAP cluster (about $631-641) in late October and has not reclaimed it.
- The EMA 50 is closing in on the EMA 200.
- The September spike to roughly $790 has fully retraced. Price is back at the bottom of the year-long $560-$720 range.
- A mean-reversion bounce is possible because RSI is near 30 and price is near the lower band. The trend indicators still dominate.
CHART PATTERNS
- Failed breakout and full retracement: The September rally failed near $790 and gave back everything. This resembles a Bearish Double Top / Rising Wedge reversal from the reference diagram on a larger scale. The neckline equivalent is the $630-640 zone, which price has now broken.
- Year-long range: Support has held repeatedly around $560-$590 (the March, June and August lows). Resistance is around $700-$720. Price is now testing the lower part of this range.
- Measured target: The decline from about $790 to the $630 breakdown (about $160) projected from the breakdown level points to about $470-$480. That is an extreme case, and the multi-touch $560-$580 support should slow the move.
- Significance: If the $557-$580 support fails, the range breaks down and the pattern points to a much deeper fall. If support holds, price likely chops within the $560-$640 band.
POTENTIAL SCENARIOS
- Scenario 1: Bearish Trend Continuation / Test of Range Support — Bears keep control (−DI dominant, CMF in distribution, MACD negative). Price keeps failing at the $631-$641 resistance cluster and grinds toward the lower Bollinger Band and the year's range support, with possible undercuts of it. Trigger: a failed rally at $631-$641 or a daily close below $605. Target: $560-$585, with an extension to $530 if $557 breaks. Invalidation: a daily close above $660 (the EMA 50) with MACD turning up. (50% probability)
- Scenario 2: Bullish Oversold Mean-Reversion Bounce — RSI near 30 and price near the lower band, with support in the $560-$580 range, trigger a relief rally back to the moving-average cluster and possibly the midline. Trigger: a reclaim of $633 (VWAP/SMA 200D) and a CMF turn toward zero. Target: $650-$675. Invalidation: a close below $557. (30% probability)
- Scenario 3: Neutral Range Chop — Price bounces between $560 and $640 without a decisive break as the ADX fades. Trigger: ADX falling below 20 and RSI recovering to 45-50. Target: $595-$630. Invalidation: a close outside $557-$660. (20% probability)
PRICE TARGETS
- Target Price: $585.00 (97 days, about Feb 13, 2027)
- Expected Range: $520.00 to $660.00 (width $140, about 22.9% of the current price, which fits the 18-30% guidance for 61-180 days)
- Key Levels: Support at $557.41, Resistance at $633.51
OVERALL BIAS
OVERALL BIAS: BEARISH - Price is below the EMA 50/200, SMA 200D and VWAP. MACD is bearish, −DI is far above +DI with ADX at 27, and CMF at -0.28 shows heavy distribution. Oversold risk near the $557-$580 range floor limits the downside, so conviction is moderate.
This is educational analysis and not financial advice.