MU 97-day bearish forecast — Nov 8, 2026
- Bias: Bearish
- Timeframe: 97 days (made Nov 8, 2026, target date Feb 12, 2027)
- Price at analysis: $690.00
- Price target: $630.00
- Expected range: $540.00 – $745.00
- Result: Pending — graded after the close on Feb 12, 2027
Get a free AI analysis of MU today
Analysis
TECHNICAL INDICATORS
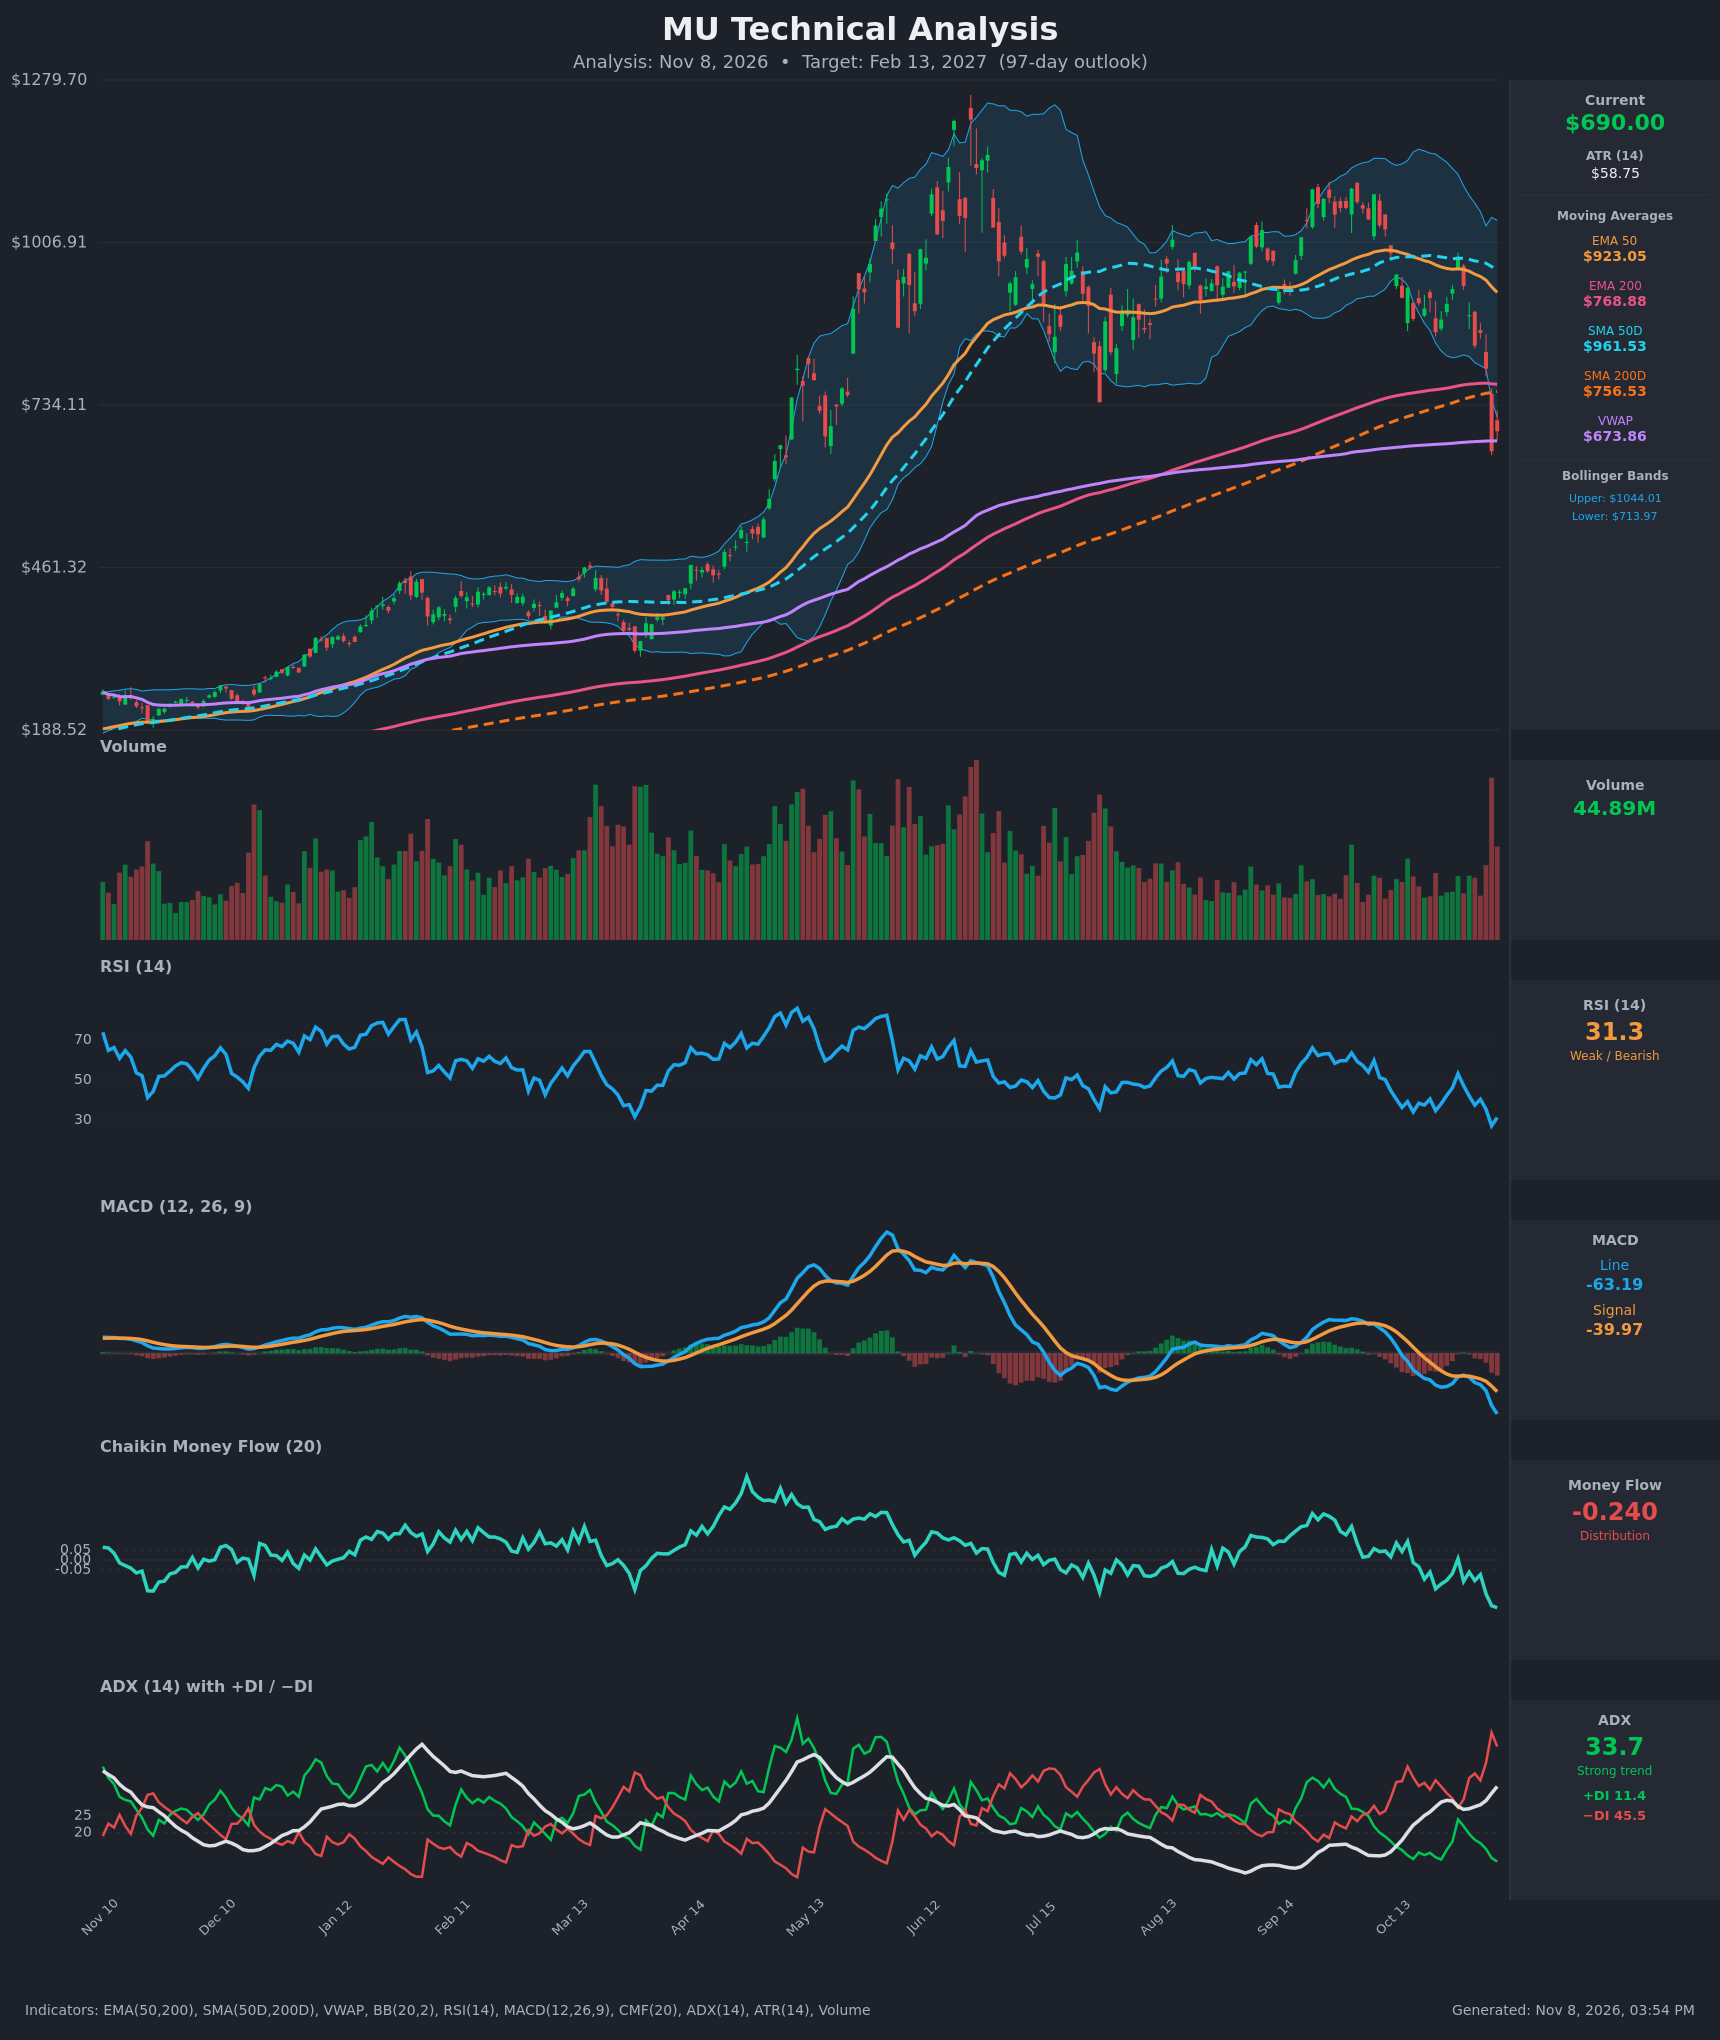
- RSI (14): 31.27, rebounding slightly from 27.1 on Nov 5 after a steady slide from the 50s in late October. It is near oversold but has not made a decisive turn, so momentum is still weak. [Bearish]
- 20 EMA: The 20 EMA isn't supplied. Price at $690 is far below the EMA 50 ($923.05), and the short-term moving averages are rolling over, so the average acts as overhead resistance. [Bearish]
- MACD: The line (-63.19) is below the signal (-39.97) and the gap is widening. The bearish crossover occurred around Oct 20, and the histogram is increasingly negative. The line is at its lowest in months. [Bearish]
- Bollinger Bands (20): Price ($690) is below the lower band ($713.97) after a sharp band expansion, with the upper band at $1044.01. That is a statistically stretched move. In a strong downtrend, band walks can persist, but a snap-back toward the mid-band is also common. [Neutral/Bearish]
- CMF (20): -0.240, deep in distribution (below -0.05) and at the lowest level on the chart. It has been negative for nearly the whole recent window, which shows persistent selling. [Distribution]
- ADX (14): 33.7 and rising from the low 20s, with -DI (45.5) far above +DI (11.4). This is a strong, accelerating downtrend with bears firmly in control. [Strong Trend – Bearish]
- Volume: 44.89M on the latest bar, a spike well above the recent average, and the Nov 5 breakdown candle was heavy red volume. This confirms the selloff. It could also be capitulation, but there is no reversal confirmation yet. [Bearish – heavy-volume breakdown]
DIVERGENCES & TRENDS
- No bullish RSI divergence yet: RSI made a lower low (27.1) alongside the lower price low ($656), so momentum confirms price. The earlier RSI peak near 53 on the bounce failed well below the prior highs.
- Lower highs on price: The June peak (~$1250) was followed by a lower high in September (~$1050–1100). The breakdown below the $730–$735 July swing-low area is the key structural break.
- Moving-average structure: Price is below the EMA 50 ($923.05), SMA 50D ($961.53), SMA 200D ($756.53) and EMA 200 ($768.88). Both 50s are still above the 200s, so there is no death cross yet. The EMA 50 is falling at roughly $10 per day, and a bearish EMA cross against the EMA 200 is likely within a few weeks if the weakness persists.
- VWAP: Price ($690) sits just above VWAP ($673.86). This is the last meaningful support, and the Nov 5 low ($656.39) sits just under it.
- MACD and DI: The MACD bearish crossover has been in place for about 2.5 weeks, and −DI crossed above +DI in the Oct 19–20 window. ADX is rising from 23.6 to 33.7, so trend strength is increasing.
- Mean-reversion risk: RSI is near 30 and price is outside the lower Bollinger Band, so a relief bounce toward the $757–$769 cluster of long-term moving averages is plausible. That zone is likely to act as resistance.
CHART PATTERNS
- Bearish Head and Shoulders / Double Top (reversal): After a parabolic advance from ~$190 to ~$1250, price made a lower high in September and then broke the ~$730 neckline on heavy volume. This fits the reversal family in the reference diagram. The full measured move (~$520) implies a very deep target, so I treat it as a long-term downside bias rather than a 97-day target.
- Bearish continuation context: The breakdown from the September consolidation looks like a descending channel or flag from the ~$1050 area, which resolved lower.
- Significance: The $757–$769 zone (SMA 200D and EMA 200) is the first major resistance on any bounce. A failed retest there would be a classic breakdown-retest, with downside toward $560–$600.
POTENTIAL SCENARIOS
- Scenario 1: Bearish Breakdown Continuation — Price bounces weakly, fails near the 200-day averages, and rolls over again as ADX stays above 25 with −DI dominant. Trigger: close below $656 (the Nov 5 low) or rejection at $757–$770. Target: $560–$600, with an extension toward $520. Invalidation: weekly close above $800 with MACD turning up. (50% probability)
- Scenario 2: Bullish Oversold Relief Rally — Capitulation volume marks a short-term low, and RSI and CMF turn up as price mean-reverts to the 200-day averages and the middle of the Bollinger Band. Trigger: reclaim of $714 (the lower band) and a close above $770. Target: $800–$860. Invalidation: close below $656. (35% probability)
- Scenario 3: Neutral Base Building — Price stabilises in a wide $620–$760 range between VWAP/recent-low support and the 200-day averages as volatility compresses. Trigger: ADX falls below 25 and RSI holds 35–50. Target: ~$680–$720. Invalidation: close outside $600–$780. (15% probability)
PRICE TARGETS
- Target Price: $630.00 (97-day horizon, about -8.7% from $690)
- Expected Range: $540.00 to $745.00 (width $205, about 29.7% of current price, in line with the 61–180 day guidance)
- Key Levels: Support at $656.39, Resistance at $756.53
OVERALL BIAS
OVERALL BIAS: BEARISH - A heavy-volume breakdown below the prior swing lows, with ADX at 33.7 and −DI far above +DI, a widening bearish MACD gap, CMF at -0.24, and price below all major moving averages. Oversold conditions make a relief bounce likely, but it should meet resistance at the $757–$769 long-term averages before another leg lower.
This is educational analysis and not financial advice.