USO 97-day bearish forecast — Nov 8, 2026
- Bias: Bearish
- Timeframe: 97 days (made Nov 8, 2026, target date Feb 12, 2027)
- Price at analysis: $148.41
- Price target: $137.00
- Expected range: $122.00 – $160.00
- Result: Pending — graded after the close on Feb 12, 2027
Get a free AI analysis of USO today
Analysis
TECHNICAL INDICATORS
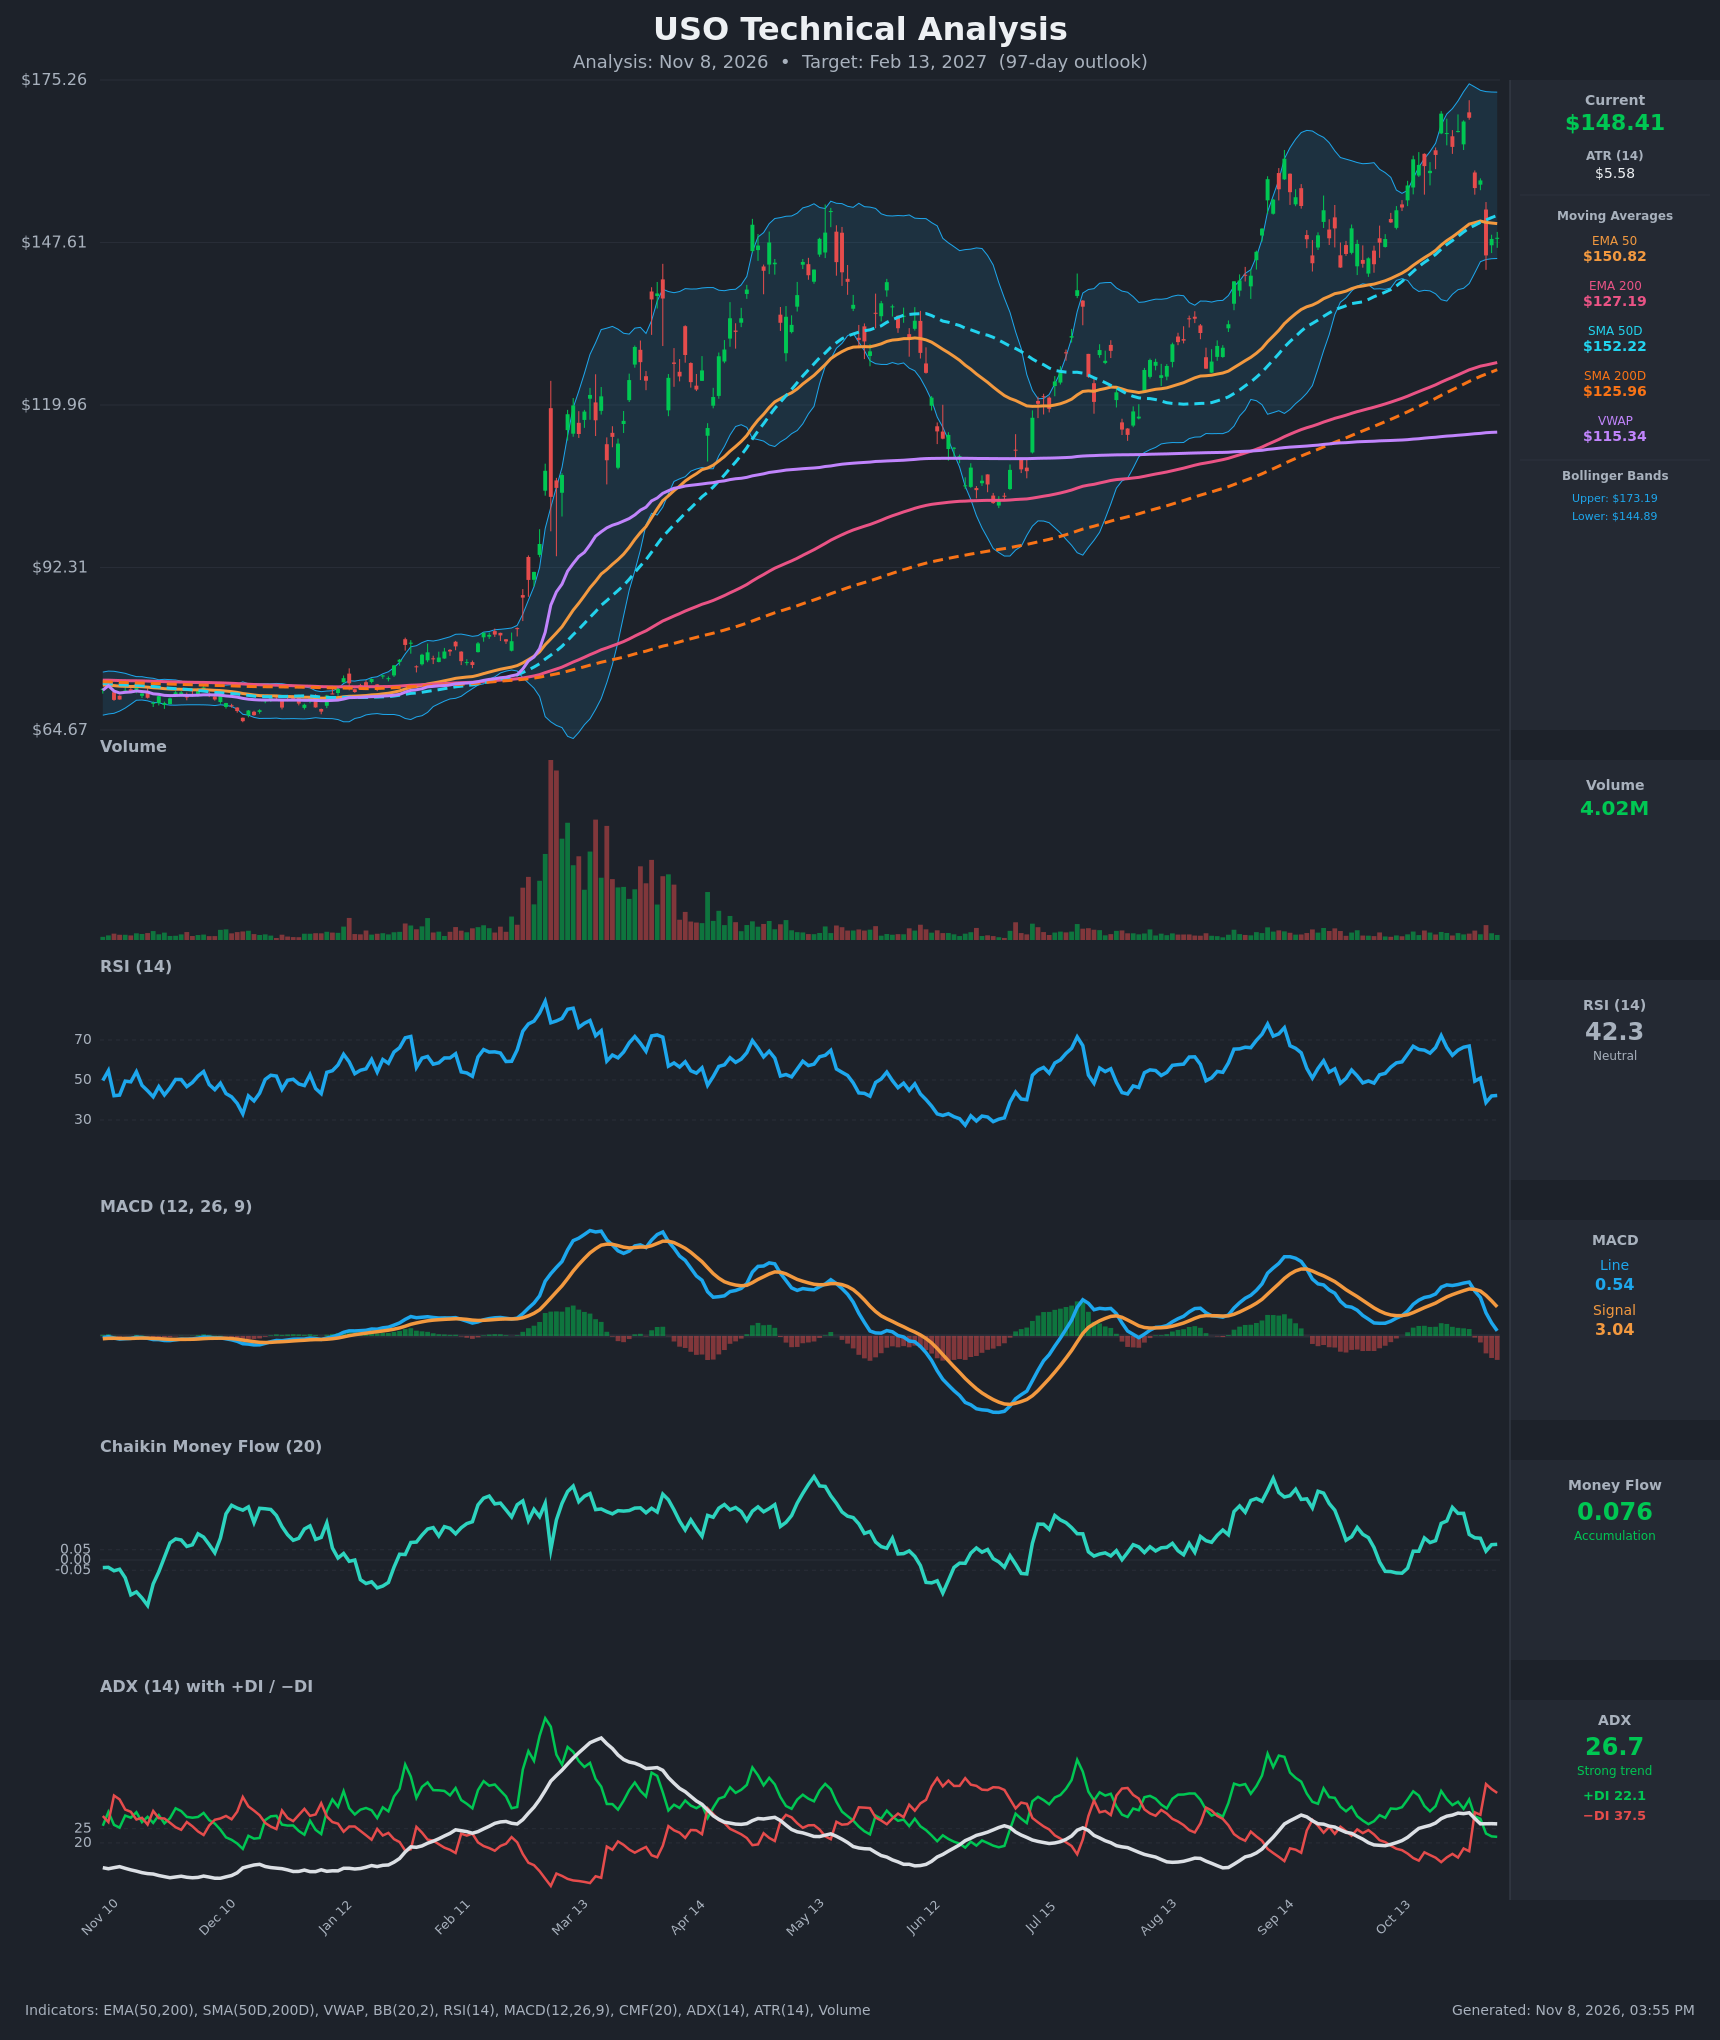
- RSI (14): 42.27, down sharply from 67 on Oct 30 and 49 on Nov 2, after a drop below 50. It is not oversold, so there is room to fall further. Momentum is bearish but not yet exhausted. [Bearish]
- 20 EMA: The 20 EMA is not provided. The EMA 50 ($150.82) and SMA 50D ($152.22) are both above price at $148.41 and have turned into overhead resistance. On the chart, price is also slipping beneath the 20-period area. [Bearish]
- MACD: The line (0.54) crossed below the signal (3.04) on Nov 2. The gap has widened over the last four bars (line 4.70, 4.02, 2.42, 1.36, 0.54), and the histogram is deeply negative and falling. This is a fresh bearish crossover with accelerating downside momentum. [Bearish]
- Bollinger Bands (20): Upper $173.19, lower $144.89. Price sits in the lower part of the band (about 12% of the band width), after rejection near the upper band at about $169. The bands are very wide, which reflects high volatility. A close below $144.89 would signal a downside band-walk. [Bearish]
- CMF (20): 0.076 is mildly positive (above +0.05) but has faded from 0.256 on Oct 27. Buying pressure is weakening, not reversing into distribution. This is the one supportive reading. [Accumulation]
- ADX (14): 26.7 with −DI at 37.5 above +DI at 22.1. The DI crossover happened Nov 2, and −DI has since widened the gap. ADX is above 25 but slightly falling from 30.6, as the trend flipped from up to down. [Strong Trend – Bearish]
- Volume: 4.02M, in line with the quiet baseline of recent months and far below the February–March spike. The Nov 2 and Nov 4 drops were not met with panic volume. The selloff is orderly, and there is no capitulation or strong dip-buying. [Neutral]
DIVERGENCES & TRENDS
- Bearish crossovers: MACD crossed bearishly on Nov 2 and the DI lines crossed bearishly the same day (−DI 30.7 vs +DI 29.3). Price then lost EMA 50 and SMA 50D.
- RSI and price: The Oct 30 high of $168.83 came with RSI of 67, below the 72 peak on Oct 23 at $169.53. This is a mild bearish divergence in the top.
- CMF: It has trended down from its late-October highs, but it remains positive. There is no clear distribution signal yet.
- Long-term trend: There is no golden or death cross. EMA 200 ($127.19) and SMA 200D ($125.96) are rising, and price is about 18% above them, so the long-term trend is still up. The short-term trend has turned down.
- VWAP: VWAP at $115.34 is far below price. This shows how extended the move has been and suggests substantial room for mean reversion.
- Volatility: The ATR of $5.58 (about 3.8% of price) implies large swings.
CHART PATTERNS
- Bearish Double Top (reference diagram): The two peaks at about $169.5 (Oct 23) and $168.8 (Oct 30) have a neckline near $145 (the Nov 4 low of $145.41, plus the lower Bollinger Band). The pullback after the second peak fits this pattern. A confirmed break below $145 gives a measured move of about $24 (peak ~$169 minus neckline ~$145), which points to about $121 as an extended target. The first support is the EMA 200 area near $127.
- Larger structure: Higher lows since June (about $100 to $120 to $145) form a rising channel. The long-term uptrend is intact above about $127. A bounce from $145 that reclaims $152 would invalidate the double top.
- Rising MAs: The EMA 50 and SMA 50D have flattened and are about to roll over, which adds to near-term resistance.
POTENTIAL SCENARIOS
- Scenario 1: Bearish Double-Top Breakdown — The neckline at about $145 fails and price rotates lower toward the rising 200-day averages, as RSI drops toward 30 and MACD falls below zero. Trigger: daily close below $145.41 and the lower Bollinger Band ($144.89). Target: $127–$135, with an extension to about $121. Invalidation: daily close above $152.22 (SMA 50D). (50% probability)
- Scenario 2: Bullish Higher-Low Rebound — The uptrend resumes. Price holds the $145 area, which is also near the EMA 50, and rebounds with CMF still positive. Trigger: reclaim of $152–$153 with MACD turning up. Target: $165–$172, a retest of the Oct highs and the upper band. Invalidation: close below $144.89. (30% probability)
- Scenario 3: Neutral Choppy Range — Price consolidates between $138 and $158 as oil digests the rally, ADX fades below 20 and MAs converge. Trigger: repeated failures at both $152 and $140. Target: $145–$150. Invalidation: close outside $138–$158. (20% probability)
PRICE TARGETS
- Target Price: $137.00 (97-day horizon, Feb 13, 2027)
- Expected Range: $122.00 to $160.00. Width is $38, about 25.6% of the current price, which is appropriate for a 61–180 day timeframe.
- Key Levels: Support at $145.41 (Nov 4 low and lower Bollinger Band), with deeper support at the EMA 200 ($127.19). Resistance at $152.22 (SMA 50D), with further resistance at $168.83.
OVERALL BIAS
OVERALL BIAS: BEARISH - Price has rolled over from a probable double top near $169 and sits below the EMA 50 and SMA 50D. MACD and the DI lines both crossed bearishly, and −DI is well above +DI with ADX above 25. The long-term uptrend and positive CMF limit conviction, so the expected decline is toward $137 and not a full collapse.
This is educational analysis and not financial advice.