CAT 44-day bearish forecast — Nov 9, 2026
- Bias: Bearish
- Timeframe: 44 days (made Nov 9, 2026, target date Dec 22, 2026)
- Price at analysis: $558.63
- Price target: $530.00
- Expected range: $478.00 – $576.00
- Result: Pending — graded after the close on Dec 22, 2026
Get a free AI analysis of CAT today
Analysis
TECHNICAL INDICATORS
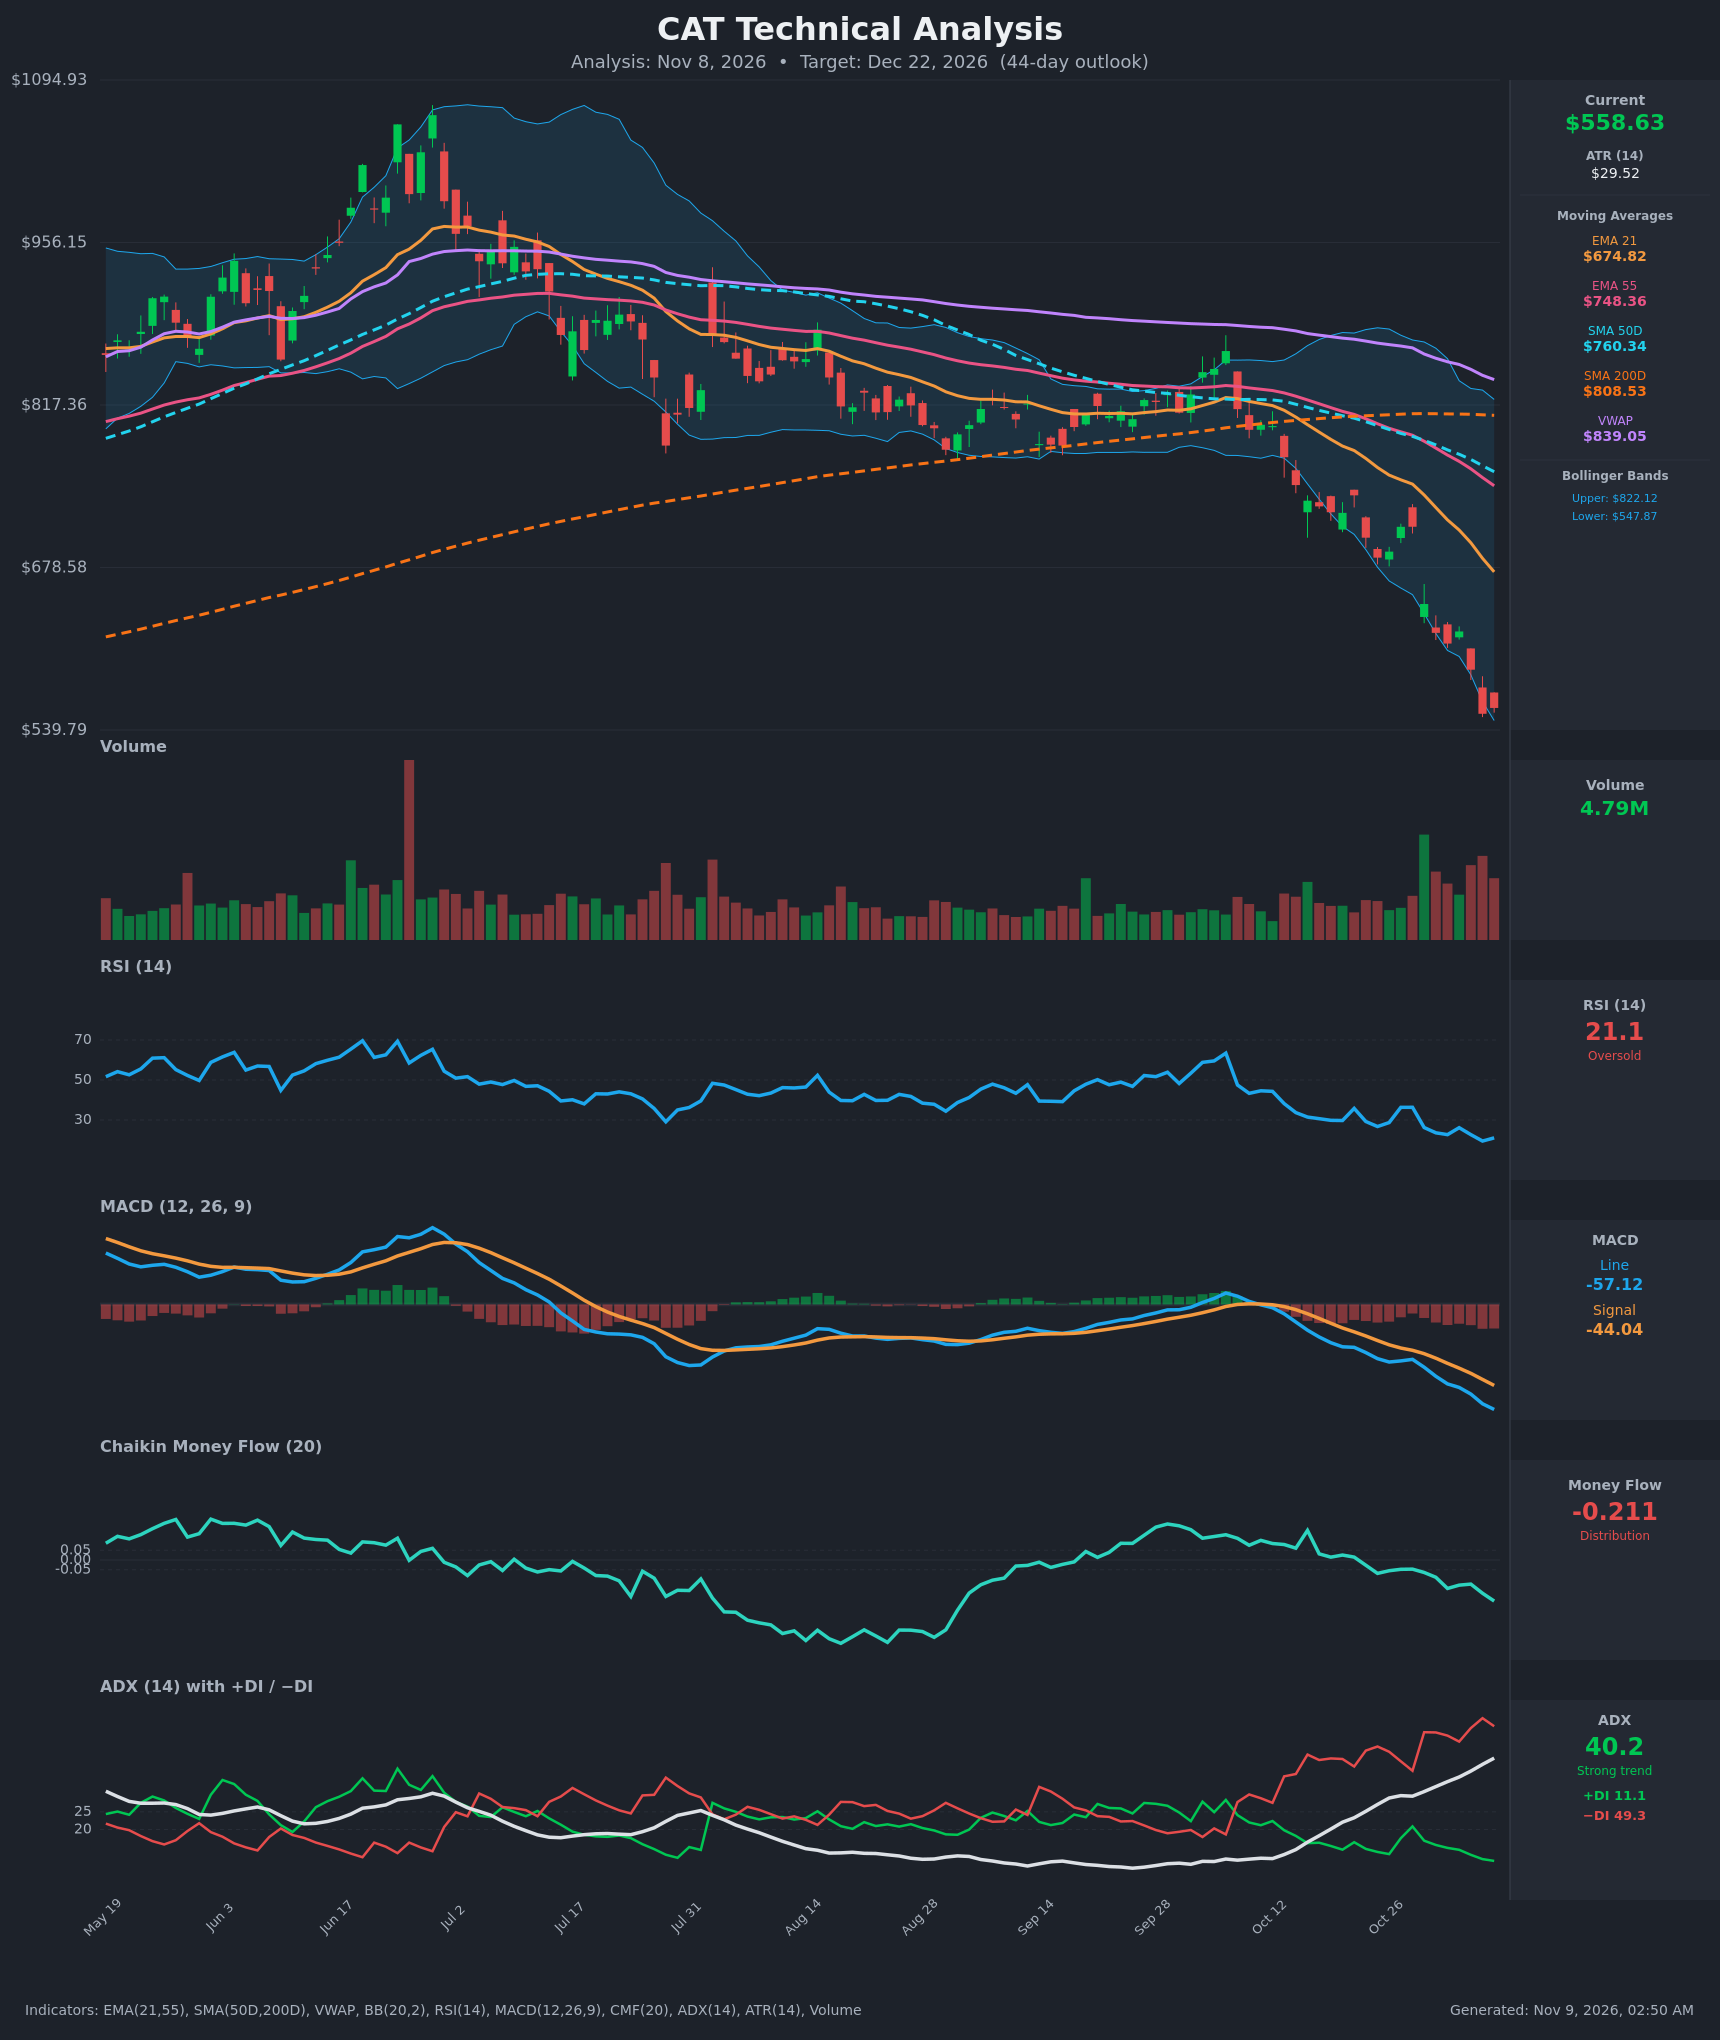
- RSI (14): 21.07, deeply oversold and just off the 19.5 low on Nov 5. It has fallen from the mid-30s in late October, and each bounce has failed at lower levels (36 on Oct 27-28). Oversold readings in strong downtrends can persist, but the stretched reading raises the odds of a relief bounce. [Bearish]
- 20 EMA: The nearest provided value is EMA 21 at $674.82, with price at $558.63, about 17% below it. The EMA is falling steeply and is now resistance. EMA 21 is also below EMA 55 ($748.36), so the short-term trend is firmly down. [Bearish]
- MACD: Line -57.12 is below signal -44.04, a histogram of about -13. The line has been below the signal for the whole 15-bar window and the gap keeps widening (-10 to -13 over the last bars). No sign of a momentum turn yet. [Bearish]
- Bollinger Bands (20): Upper $822.12, lower $547.88. The bands are very wide after the volatility expansion. Price is hugging the lower band at $558.63, about $11 above it, and the chart shows candles walking the band down. Band-walking signals trend strength, though it also marks short-term exhaustion. [Bearish]
- CMF (20): -0.211, well below -0.05. It turned negative on Oct 22 and has deepened steadily, from +0.015 to -0.211. This is sustained, heavy distribution. [Distribution]
- ADX (14): 40.2 and rising (20.1 on Oct 19), with −DI at 49.3 far above +DI at 11.1. This is a strong, accelerating downtrend with bears firmly in control. [Strong Trend – Bearish]
- Volume: 4.79M, elevated against the quiet Aug-Sep baseline. The last several sessions show heavy red volume on the breakdown, which is real selling pressure. There is no capitulation spike comparable to the June peak, so a final washout may not have happened yet. [Bearish – distribution on elevated volume]
DIVERGENCES & TRENDS
- No bullish divergence yet: The RSI low on Nov 5 (19.5) came with a new price low. The Nov 6 close at $558.63 is above the Nov 5 close of $553.64 but is not confirmed by MACD or CMF, which both made fresh lows.
- MACD and CMF: Both are still making lower lows alongside price, so the downtrend is confirmed. A bullish divergence would require RSI or MACD to hold higher while price retests $540.
- Moving average structure: Price is below every average, including the 200-day SMA ($808.53) and VWAP ($839.05).
- Death cross: SMA50 crossed below SMA200 around Oct 22 ($803 vs $808). That is a major bearish trend signal. EMA 21 below EMA 55 was already in place.
- DI and trend strength: −DI has stayed above +DI throughout the window, and ADX has risen from about 20 to over 40.
- Moving average slopes: EMA 21, EMA 55 and SMA50 are all sloping down at accelerating rates, and the gap to the 200-day SMA keeps widening.
- Price action: Price made a series of lower highs from the June peak near $1,050, consolidated through Aug-Oct around $800-$850, then broke down sharply from that base. The sequence is roughly -$170 in 14 sessions.
CHART PATTERNS
- Loosely resembles a Bearish Head and Shoulders: The left shoulder is near $950, the head is the June peak near $1,050, and the right shoulder is the Sep-Oct bounce to about $870. The neckline sits around $790-$810, near the 200-day SMA, and has broken. The measured move (head to neckline, about $250-$260) projects roughly $530-$550. Price is already close to that zone, so much of the move may be realized.
- Breakdown from a sideways base: The Aug-Oct range was a rectangle-like consolidation that failed to the downside, which is a bearish continuation of the trend.
- Current price action: The vertical decline into the lower Bollinger Band is an extended move. A bearish flag or pennant, or a relief bounce to the $613-$675 area, is the most likely next structure before any further leg down.
- Significance: The pattern supports a bearish bias, but the measured target is already nearly reached, so further downside is likely to be shallower than the last two weeks.
POTENTIAL SCENARIOS
- Scenario 1: Bearish Trend Continuation — The strong trend (ADX 40, −DI 49) and distribution (CMF -0.21) keep pressure on. Price probes the lower band, makes only weak, short-lived bounces below the falling EMA 21, and slides to the head-and-shoulders measured-move area and below. Trigger: daily close below $539.79 (the chart low) on elevated volume. Target: $500-$530. Invalidation: daily close above $613.62 with RSI above 40. (50% probability)
- Scenario 2: Bullish Oversold Relief Bounce — RSI near 20 and price at the lower band set up a mean-reversion rally. Price recovers toward EMA 21 and fills part of the gap, but stays below the falling EMA 55 and SMA50, so it remains a counter-trend rally. Trigger: bullish RSI divergence plus a close above $613.62. Target: $650-$675 (EMA 21 area). Invalidation: close below $539.79 on rising volume. (35% probability)
- Scenario 3: Neutral Base Building — Selling exhausts and price chops between about $540 and $615 for weeks while ADX rolls over. Trigger: a series of closes inside the $540-$615 range with CMF recovering toward zero. Target: $560-$590. Invalidation: a close outside the range in either direction. (15% probability)
PRICE TARGETS
- Target Price: $530.00 (44-day horizon)
- Expected Range: $478.00 to $576.00 (width $98, about 17.5% of current price, consistent with the 30-60 day guidance)
- Key Levels: Support at $539.79, Resistance at $613.62
OVERALL BIAS
OVERALL BIAS: BEARISH - A strong, accelerating downtrend (ADX 40.2, −DI 49.3 vs +DI 11.1), a death cross, price below all key moving averages and heavy distribution (CMF -0.211) outweigh the oversold RSI of 21. Expect a possible relief bounce along the way, but the path of least resistance still points to slightly lower levels near the measured-move target around $530.
This is educational analysis and not financial advice.