CAT 36-day bearish forecast — Nov 13, 2026
- Bias: Bearish
- Timeframe: 36 days (made Nov 13, 2026, target date Dec 18, 2026)
- Price at analysis: $605.28
- Price target: $585.00
- Expected range: $535.00 – $645.00
- Result: Pending — graded after the close on Dec 18, 2026
Get a free AI analysis of CAT today
Analysis
TECHNICAL INDICATORS
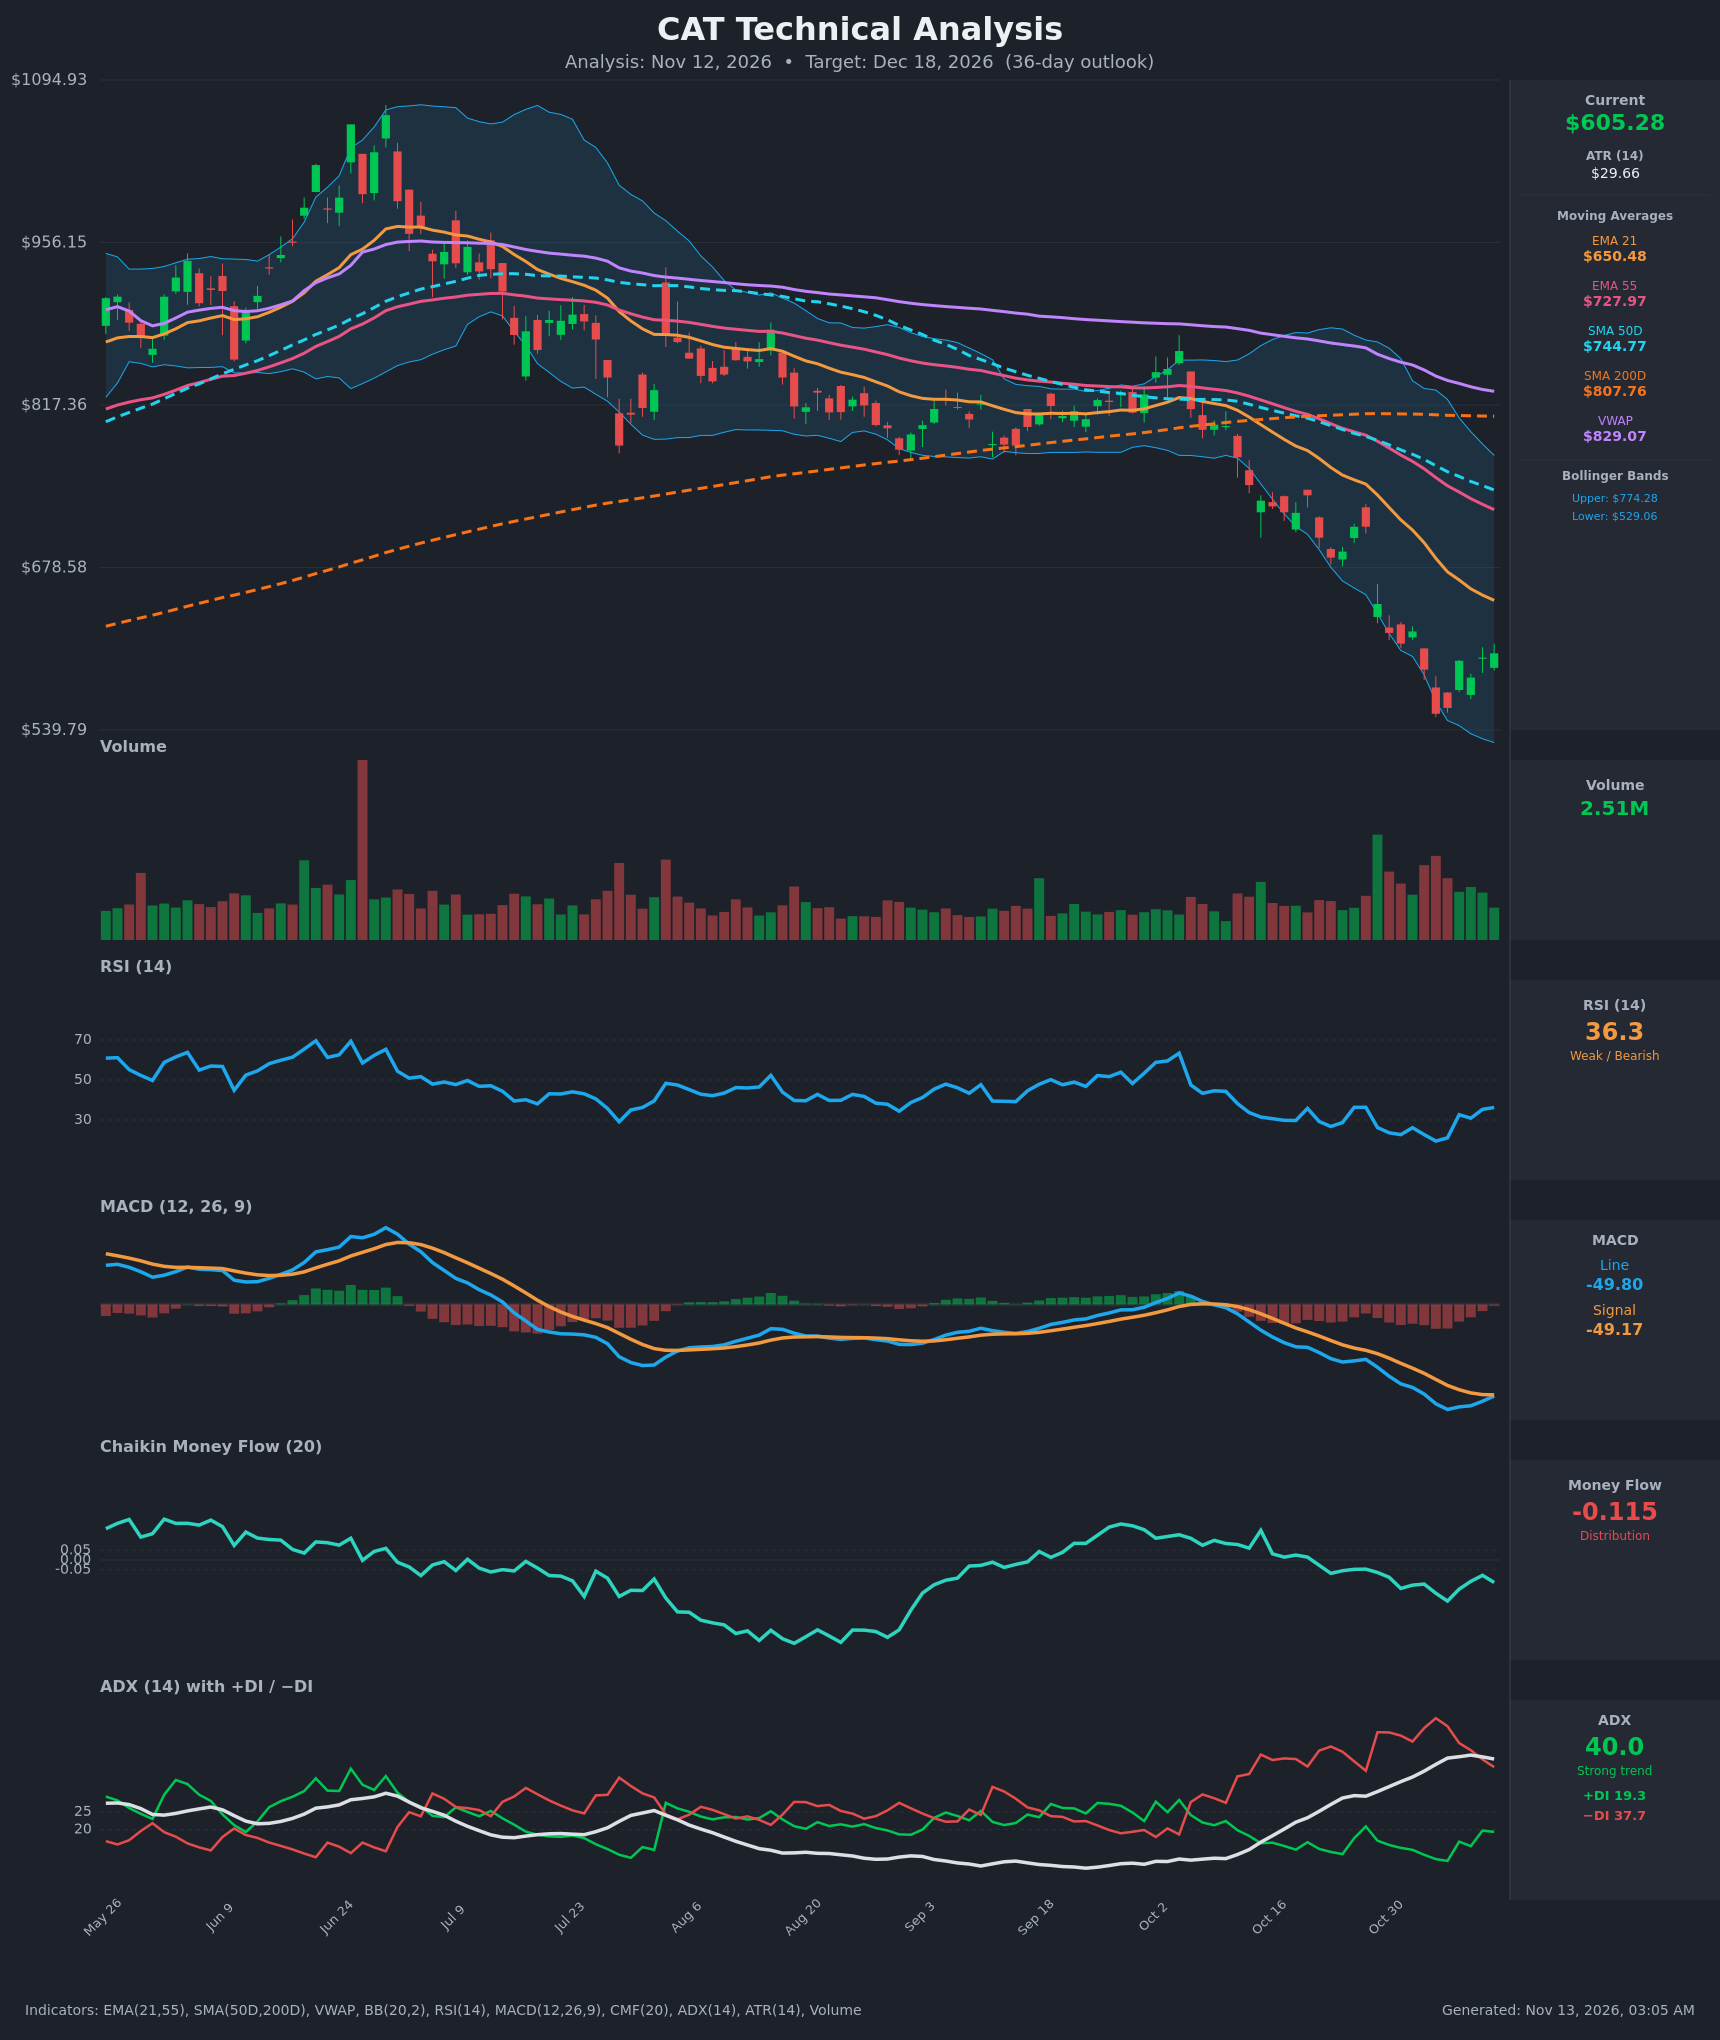
- RSI (14): 36.3, recovering from an oversold low of 19.5 on Nov 5 but still below 50. The bounce is real but momentum remains weak, and RSI is turning up into a bearish zone rather than showing a trend change. [Bearish]
- 20 EMA (EMA 21): $650.48, falling steadily (from $764 on Oct 23). Price at $605.28 is about 7% below it, so the EMA acts as dynamic resistance. EMA21 is also below EMA55 ($727.97) in a bearish stack. [Bearish]
- MACD: Line -49.80 vs. Signal -49.17. The line is nearly flat against the signal after a sharp decline, and the histogram has narrowed to about -0.6 from roughly -13. A bullish crossover is close, but both lines remain deeply negative, so this is only a fading-downside-momentum signal. [Neutral]
- Bollinger Bands (20): Upper $774.28, lower $529.06, midline roughly $651.7. Price is in the lower half, having bounced off the lower band (the Nov 5-6 lows touched or pierced it). The bands are wide, reflecting high volatility. Price has not reclaimed the midline, so the bounce looks like a relief rally within a downtrend. [Bearish]
- CMF (20): -0.115, well below -0.05, in distribution territory. It has been negative for the whole decline, with only a modest improvement from -0.211. [Distribution]
- ADX (14): 40.0 with -DI (37.7) well above +DI (19.3). This is a strong, mature downtrend. ADX has flattened and ticked down from 41.1, and the gap between -DI and +DI is narrowing, which hints at selling exhaustion. [Strong Trend – Bearish]
- Volume: 2.51M on the latest bar, with volume elevated during the Oct 29-Nov 5 selloff. The bounce candles carry mixed volume, with no decisive accumulation surge. [Neutral / Mildly Bearish]
DIVERGENCES & TRENDS
- Moving average structure: Price ($605) is below EMA21 ($650), EMA55 ($728), SMA50 ($745), SMA200 ($808) and VWAP ($829). This is a fully bearish alignment.
- Death cross: SMA50D crossed below SMA200D in early-to-mid October, and the gap is still widening ($745 vs. $808). EMA21 crossed below EMA55 earlier in the decline.
- MACD: It made a new low on Nov 6 (-57.1) and has been recovering since. Price made its low on Nov 5 ($553.64) and has bounced about 9%. A bullish MACD crossover is imminent, but it would occur well below zero.
- RSI: Price lows at $553 coincided with RSI near 19.5, a deeply oversold reading. The subsequent higher RSI lows (30.9 on Nov 10) against a price at $584 suggest mild stabilization, not a confirmed bullish divergence.
- CMF and ADX: CMF is still negative and has not confirmed the bounce. ADX is plateauing around 40, a level where trends often pause or consolidate before resuming or reversing.
- Price structure: The decline from roughly $1,090 to $554 is about a 49% drawdown, with a sequence of lower highs and lower lows. The bounce is stalling below the falling EMA21.
CHART PATTERNS
- Primary pattern: Bearish continuation / flag-like rebound. After the sharp Oct 29-Nov 5 drop, the small upward-sloping retracement resembles a Bearish Flag/Rising Wedge from the reference diagram. A break back below ~$584-$590 would project the measured move lower, with a target around $520-$540.
- Secondary view: possible Double Bottom. Lows at $553.64 (Nov 5) and $558.63 (Nov 6) form a tentative base. Confirmation requires a close above ~$650-$655 (EMA21 and the prior swing area), which is not yet in place.
- Large-scale structure: The peak at $1,090 followed by a roll over and lower highs looks like a major topping structure (a broad head-and-shoulders-style distribution). The downtrend remains intact until price recovers the EMA55 / SMA50 zone ($730-$745).
POTENTIAL SCENARIOS
- Scenario 1: Bearish Trend Resumption — The relief bounce fails at the falling EMA21 (~$640-$650), and sellers re-engage given -DI dominance, distribution on CMF, and the death cross. Trigger: close below $584 followed by a break of $553. Target: $540-$565, with an extension to $510-$530 (the lower BB area). Invalidation: daily close above $655 with improving CMF. (50% probability)
- Scenario 2: Bullish Relief Rally / Base Formation — Oversold conditions (RSI low of 19.5), a MACD bullish crossover, and a narrowing -DI/+DI gap fuel a mean-reversion rally toward the Bollinger midline and EMA21/EMA55. Trigger: close above $650 on rising volume. Target: $680-$730. Invalidation: close below $553. (32% probability)
- Scenario 3: Neutral Range Consolidation — Price chops between ~$555 support and ~$650 resistance as ADX cools from 40. Trigger: failure to break either extreme. Target: $580-$625. Invalidation: close outside the $553-$655 range. (18% probability)
PRICE TARGETS
For a 36-day horizon, the range width should be about 12-18% of price. Self-check: the range of $535.00 to $645.00 is $110, or 18.2% of $605.28, which is at the upper end of the guideline and consistent with the high ATR ($29.66, about 4.9% of price).
- Target Price: $585.00 (36 days, Dec 18, 2026)
- Expected Range: $535.00 to $645.00
- Key Levels: Support at $553.64, Resistance at $650.48
OVERALL BIAS
OVERALL BIAS: BEARISH - Price sits below every moving average and VWAP, the SMA50/SMA200 death cross is in place, ADX at 40 with -DI far above +DI confirms a strong downtrend, and CMF shows distribution. The oversold bounce and MACD flattening argue for a choppy path rather than a collapse, but the EMA21 near $650 should cap rallies and favor a drift modestly lower.
This is educational analysis and not financial advice.