CAT 110-day bearish forecast — Nov 9, 2026
- Bias: Bearish
- Timeframe: 110 days (made Nov 9, 2026, target date Feb 26, 2027)
- Price at analysis: $558.63
- Price target: $530.00
- Expected range: $470.00 – $625.00
- Result: Pending — graded after the close on Feb 26, 2027
Get a free AI analysis of CAT today
Analysis
TECHNICAL INDICATORS
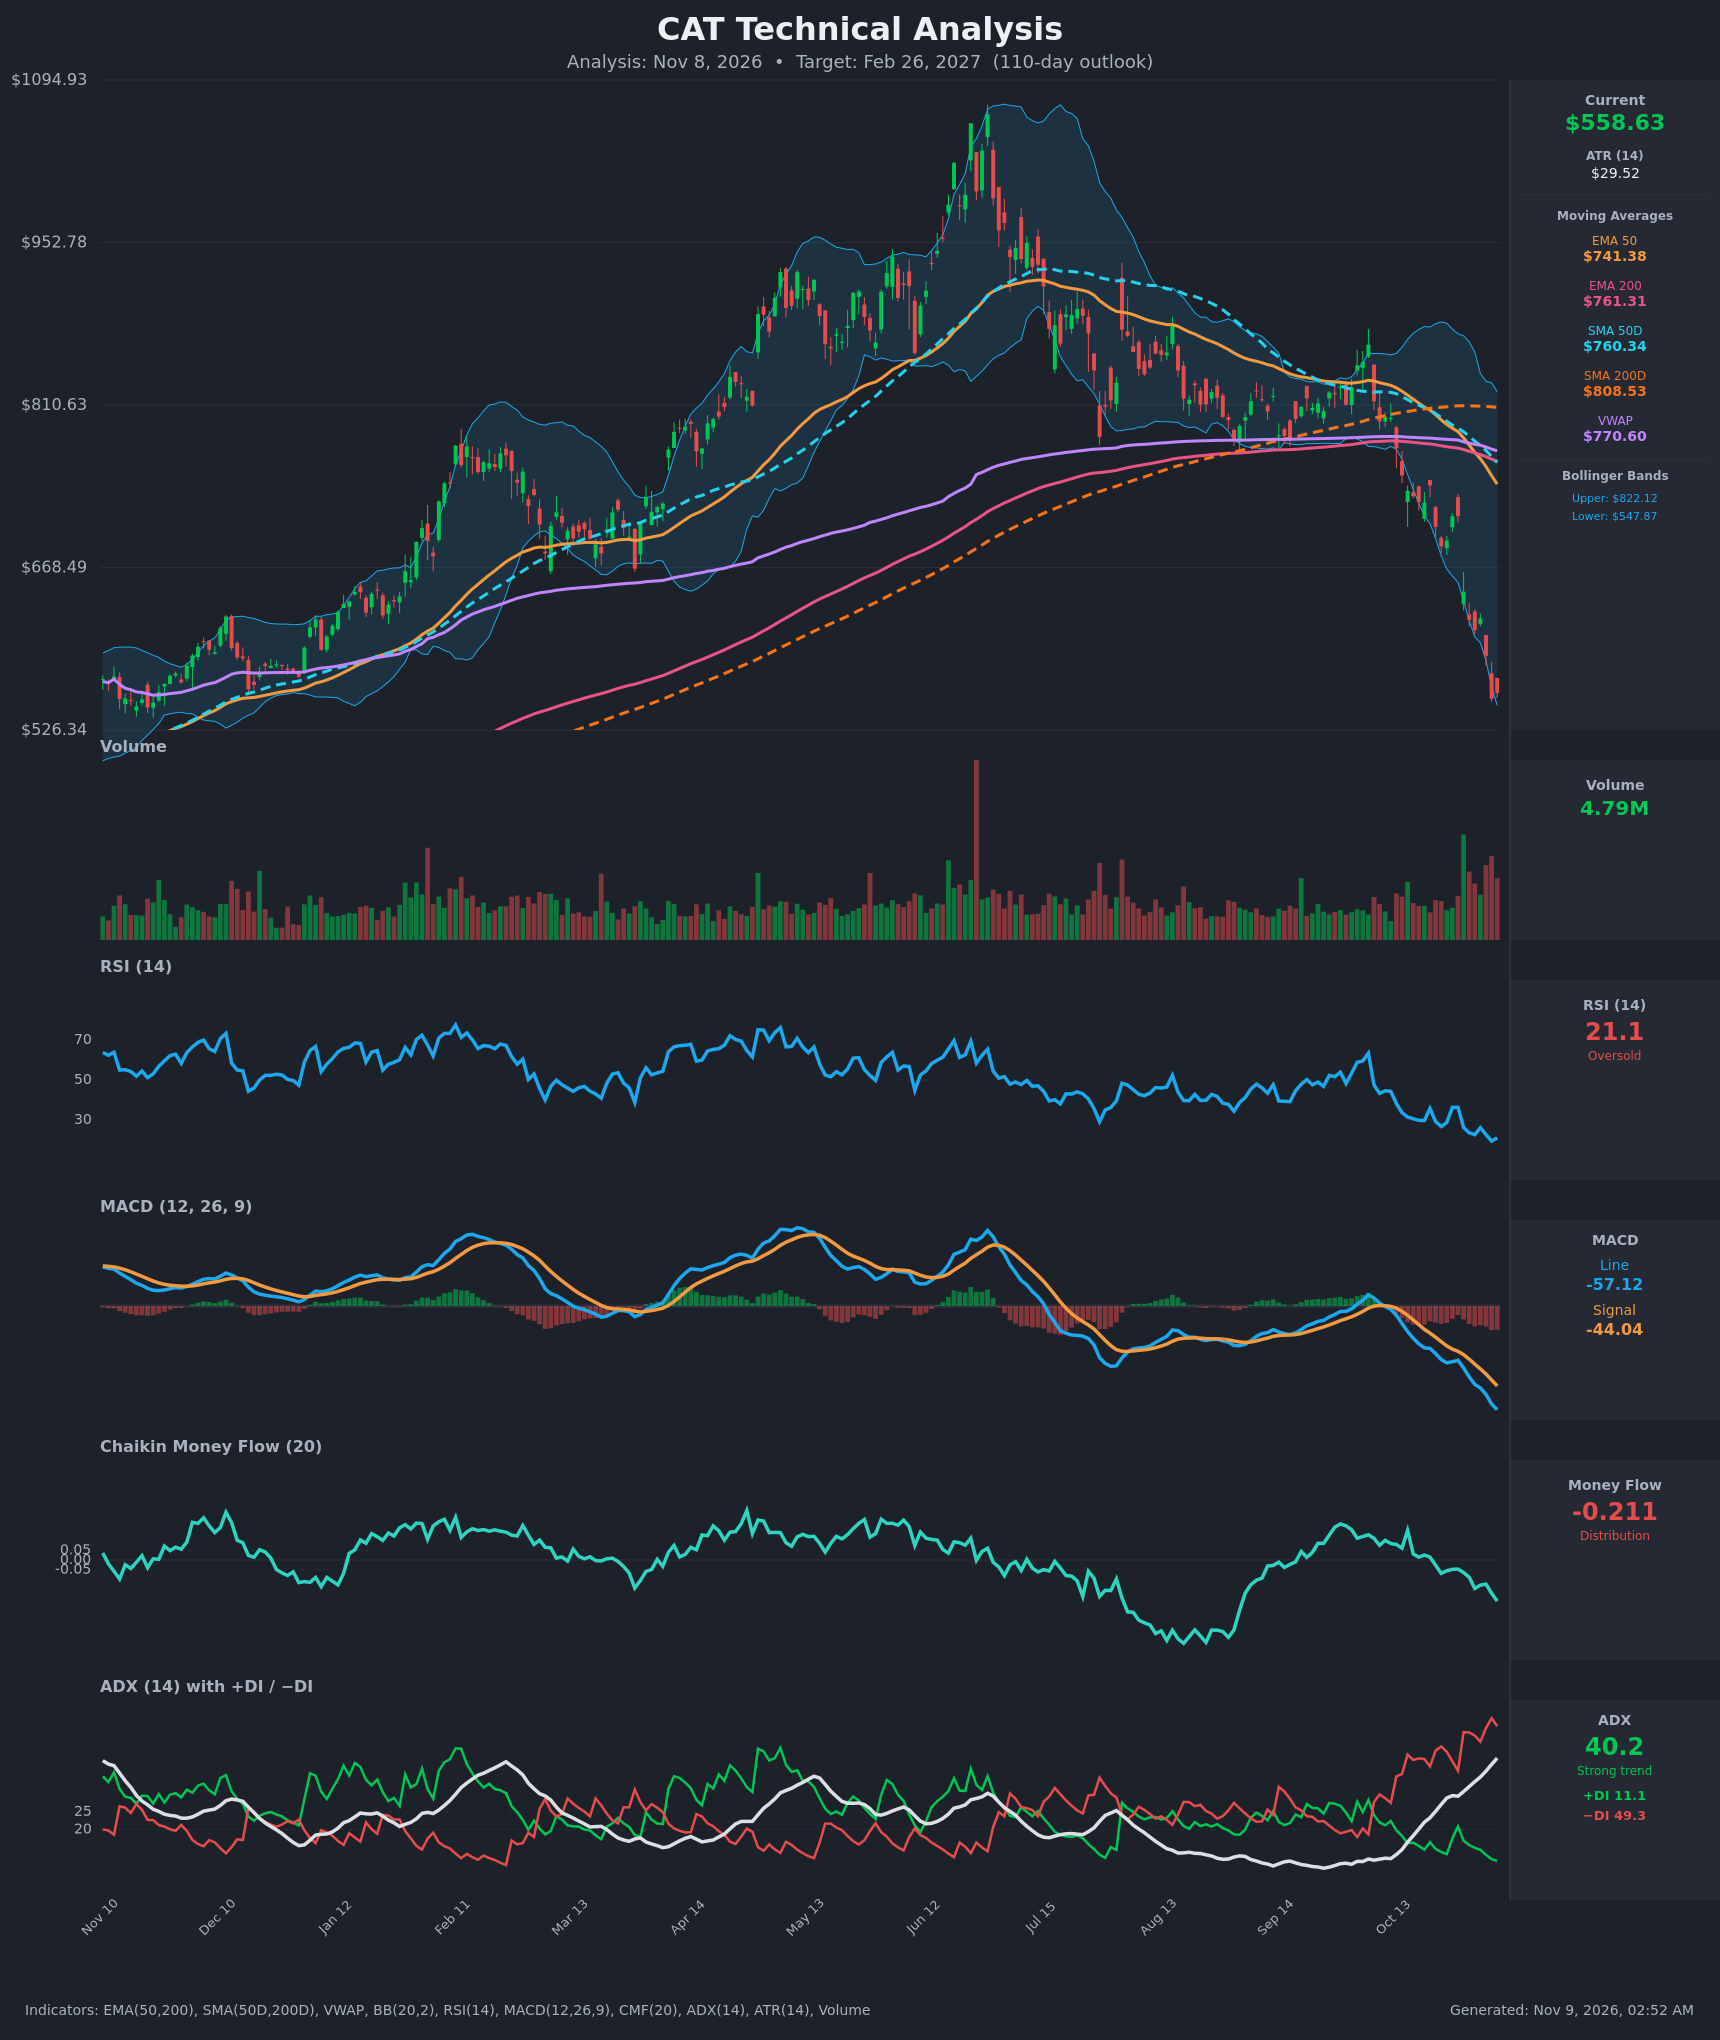
- RSI (14): 21.07, deeply oversold after printing 19.5 on Nov 5. It has been below 30 for most of the last 15 bars, and every bounce (36 on Oct 27-28, 26 on Nov 3) failed at lower highs. Oversold readings can persist in strong downtrends, though the reading does raise the odds of a relief bounce. [Bearish]
- 20 EMA: Not supplied, but the EMA 50 at $741.38 is about 25% above price and falling. Price has been below every short-term average since the Oct 29 breakdown, so the averages act as overhead resistance. [Bearish]
- MACD: Line at -57.12 is below the signal at -44.04, with a negative and widening histogram. The line has made a new low each day for the last 15 bars, so momentum is still accelerating down and there is no sign of a bullish turn yet. [Bearish]
- Bollinger Bands (20): Price at $558.63 sits just above the lower band ($547.87) and far below the upper band ($822.12). The bands are very wide, showing a volatility expansion. Price has been walking the lower band, a sign of trend strength rather than a reversal, although a stretch this extreme often brings a snap-back toward the mid-band. [Bearish]
- CMF (20): -0.211, well below -0.05 and trending lower from roughly 0.0 in mid-October. This is heavy, sustained distribution. [Distribution]
- ADX (14): 40.2 and rising from 20.1 on Oct 19, with −DI (49.3) far above +DI (11.1). Bears have been in control since mid-October, and this is a strong, mature downtrend. A reading above 40 can also signal late-stage exhaustion. [Strong Trend – Bearish]
- Volume: 4.79M, with the most recent bars among the heaviest on the chart outside the June spike. Heavy volume on red candles points to forced or panicked selling, which could be capitulation but is not confirmed by any reversal bar yet. [Bearish with possible capitulation]
DIVERGENCES & TRENDS
- No bullish divergences yet: RSI made a new low (19.5) alongside price, and MACD and CMF also made new lows. Momentum confirms the price decline.
- Death crosses: The SMA50D crossed below the SMA200D on Oct 21 (death cross). The EMA50 crossed below the EMA200 on Nov 3. Price is about 31% below the SMA200D ($808.53).
- VWAP: Price is far below VWAP ($770.60), meaning most buyers in the period are underwater and likely to sell into rallies.
- MACD: It crossed below its signal around Oct 19 and the gap has widened ever since.
- DI: −DI has dominated +DI since Oct 19 and has widened further.
- Exhaustion watch: The move from the ~$870 area in late September to $558 is a roughly 36% drop in about six weeks. Price is stretched far below its averages, so a sharp counter-trend bounce is plausible, but it would likely be corrective unless the indicators turn.
CHART PATTERNS
- Bearish Head and Shoulders (broad): The June peak near $1,090 is the head, with a lower high near $870 in September. The neckline around $760-$800 (where the 200-day average and VWAP converged) broke decisively in late October. The measured move is roughly $1,090 − $780 = ~$310 below the neckline, which projects to about $470.
- Expanding volatility / bearish continuation: The sequence of lower highs and then the sharp drop after the failed Sep/Oct rally resembles a descending channel breakdown. The next significant support is the $526 area (the left-side lows of the chart).
- Reversal caveat: No bullish reversal pattern (double bottom, falling wedge, etc.) has formed. A relief bounce would likely stall at the $620-$700 breakdown zone.
POTENTIAL SCENARIOS
- Scenario 1: Bearish Trend Continuation — The strong downtrend (ADX 40, −DI 49) grinds lower with only weak, short-lived bounces, and the head-and-shoulders measured move toward $470 plays out. Trigger: Daily close below the lower Bollinger Band ($547.87) and then below $526. Target: $470-$530. Invalidation: Daily close above $624 with RSI back above 40 and MACD histogram turning positive. (45% probability)
- Scenario 2: Bullish Oversold Relief Rally — RSI at 21 and price far below its averages trigger a sharp mean-reversion bounce as sellers exhaust. Trigger: A bullish reversal candle on high volume, an RSI move back above 30, and a MACD histogram turn. Target: $620-$690 (the prior breakdown zone and falling EMA50 area are heavy resistance). Invalidation: Failure at $624 and a new low below $526. (40% probability)
- Scenario 3: Neutral Base Building — Price stabilizes between roughly $520 and $620 for months while the indicators reset. Trigger: Contracting ADX and a flattening CMF. Target: $540-$600. Invalidation: A close outside the $500-$650 band. (15% probability)
PRICE TARGETS
- Target Price: $530.00 (110-day)
- Expected Range: $470.00 to $625.00 (width $155 ≈ 27.7% of current price, in line with the 61-180 day guidance of 18-30%)
- Key Levels: Support at $547.87 (lower Bollinger Band; next support at $526.34), Resistance at $624.00 (Nov 3 close and recent breakdown area)
OVERALL BIAS
OVERALL BIAS: BEARISH - Every trend and momentum indicator is bearish: a death cross is in place, ADX is 40 with −DI dominant, CMF shows heavy distribution, and MACD is still making new lows. The H&S measured move points toward $470. The deeply oversold RSI (21) is the main counterweight and makes sharp bounces likely, but without a divergence or reversal pattern the trend still has the edge.
This is educational analysis and not financial advice.