CAT 8-day bullish forecast — Nov 13, 2026
- Bias: Bullish
- Timeframe: 8 days (made Nov 13, 2026, target date Nov 20, 2026)
- Price at analysis: $605.40
- Price target: $614.00
- Expected range: $588.00 – $624.00
- Result: Pending — graded after the close on Nov 20, 2026
Get a free AI analysis of CAT today
Analysis
TECHNICAL INDICATORS
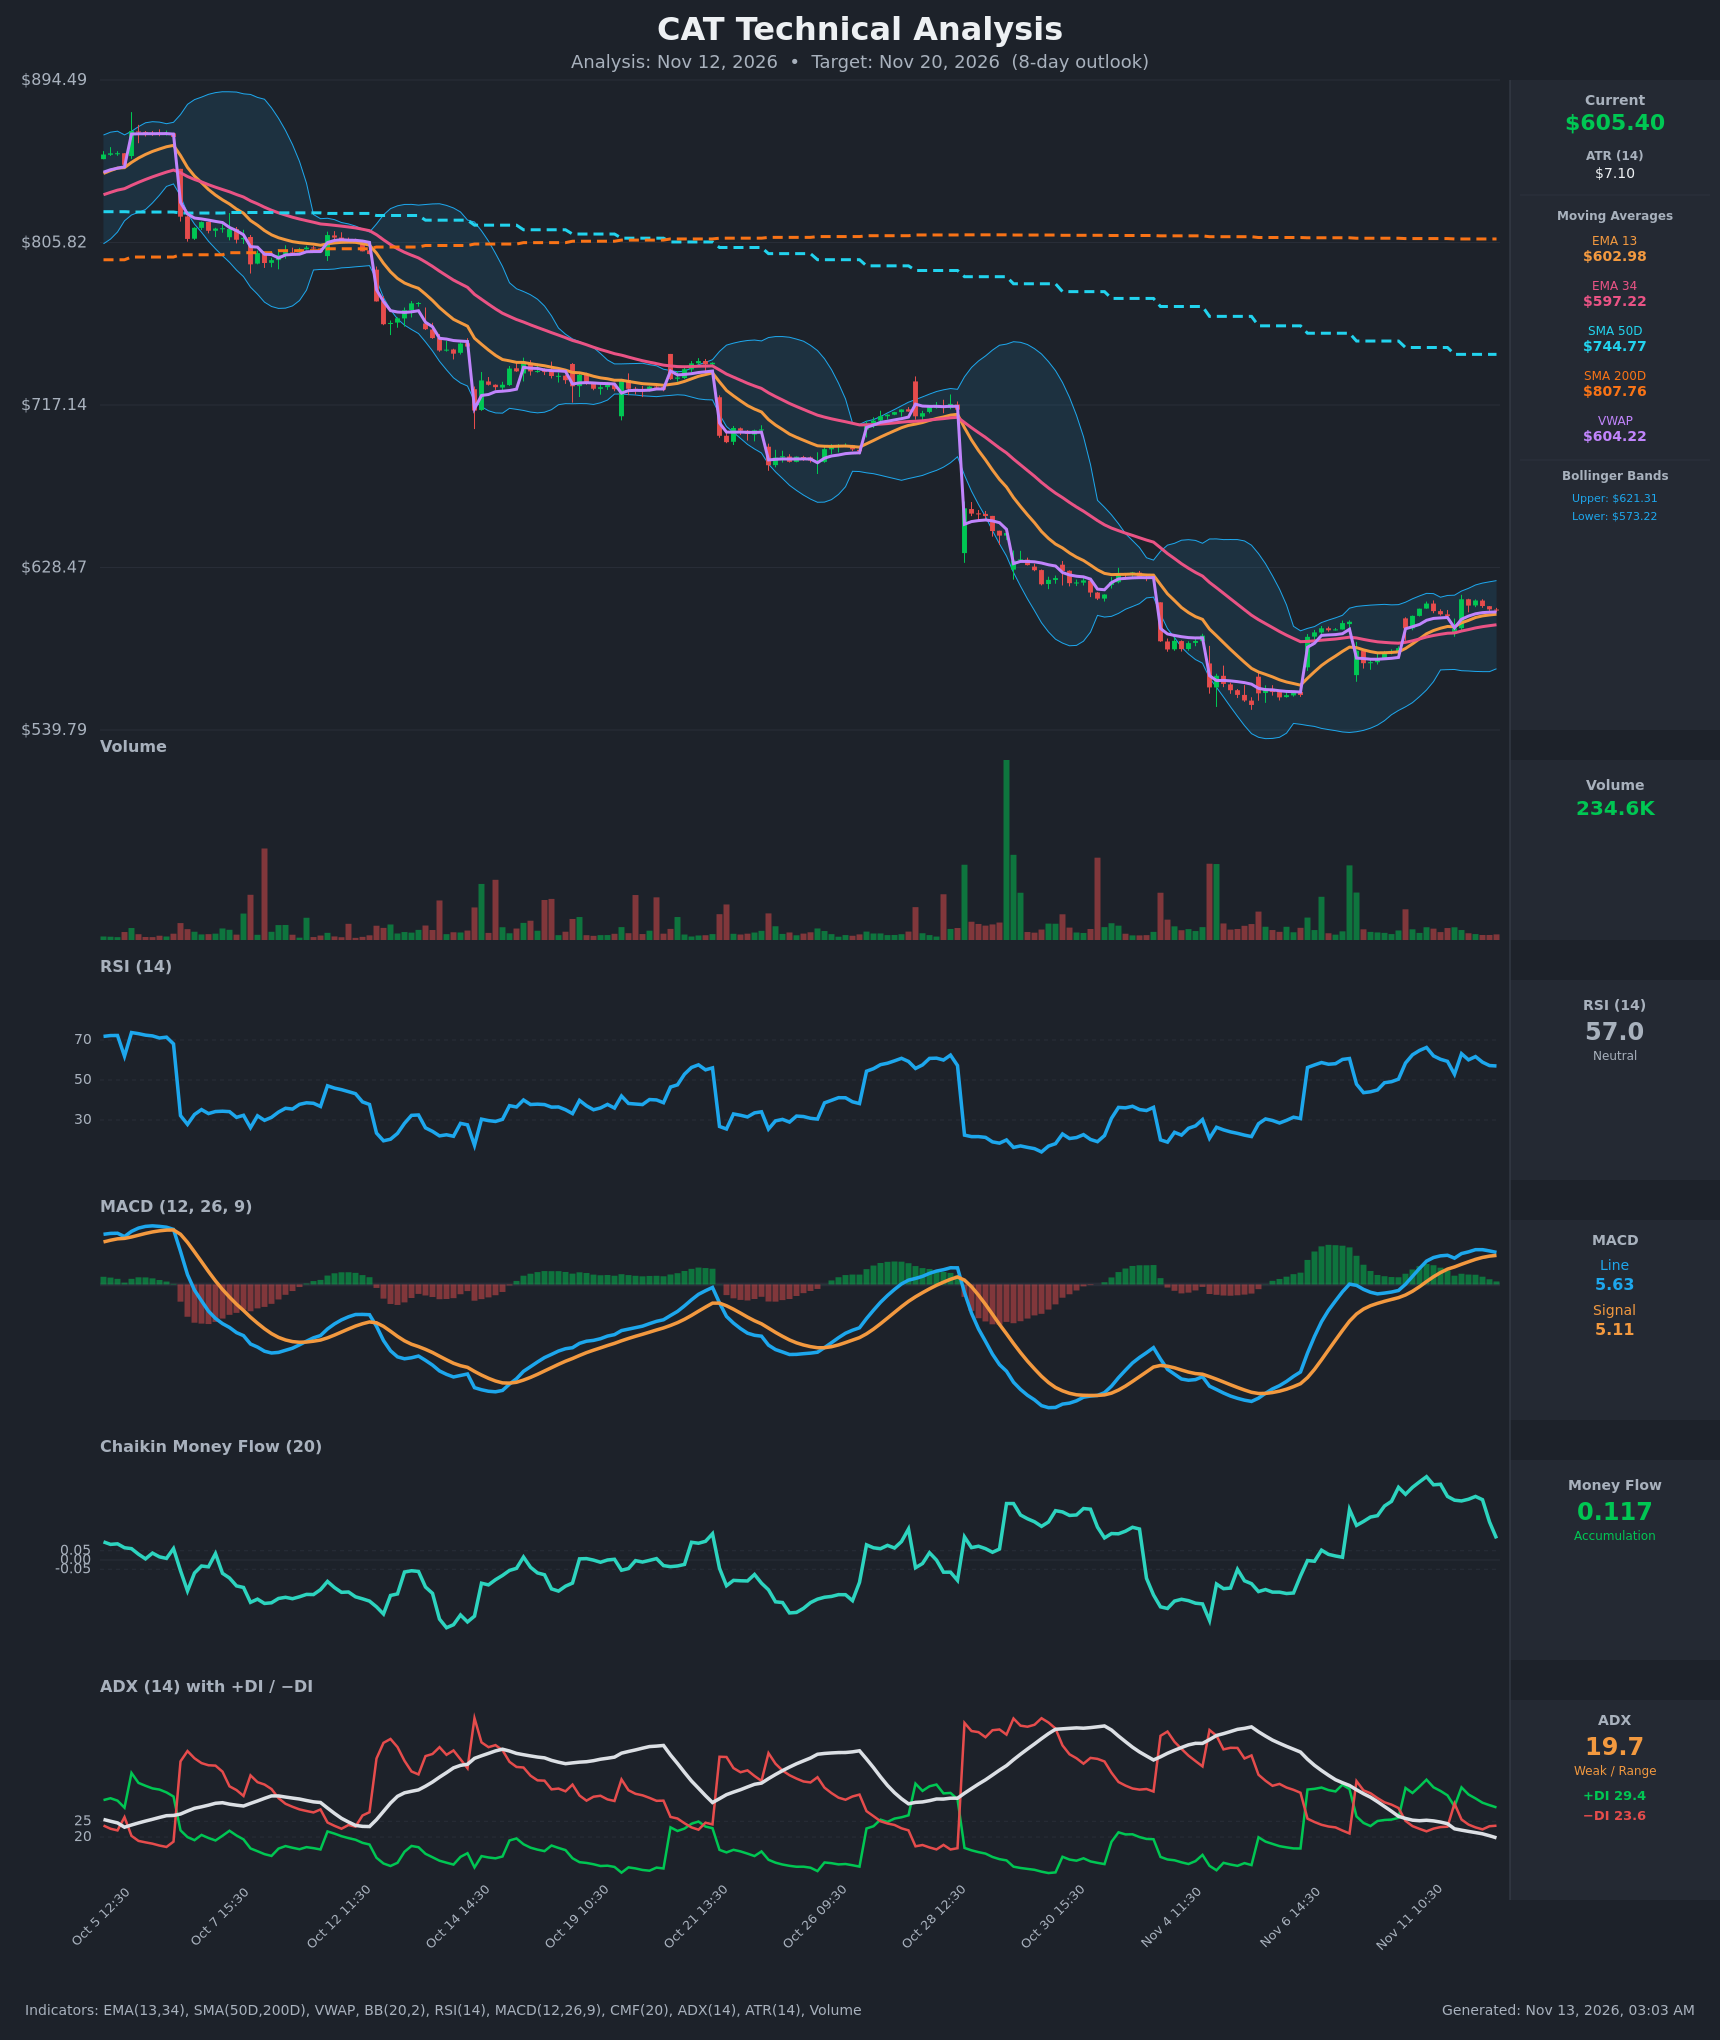
- RSI (14): 57.0, down from 66 at the Nov 11 peak and flattening. It is above 50 but has lost its overbought-leaning momentum, so the bounce is cooling rather than accelerating. [Neutral]
- EMA 13/34 (chart's 20 EMA equivalent): EMA13 is $602.98 and EMA34 is $597.22, with price at $605.40 above both. EMA13 crossed above EMA34 on Nov 11 around 11:30, and the gap is still widening slightly. Price is hugging EMA13, which is the first support. [Bullish]
- MACD: Line 5.63 is above Signal 5.11, so it is still bullish, but the histogram (+0.52) has shrunk from its peak of about +1.4 and the line is turning down. This points to momentum fading, with a possible bearish cross if price slips further. [Neutral]
- Bollinger Bands (20): Upper $621.31, lower $573.22, midline about $597. Price is in the upper half, about $16 below the upper band. The bands are narrowing after the earlier expansion, which suggests consolidation and room for a modest move either way. [Neutral]
- CMF (20): 0.117, which is accumulation, but it has dropped sharply from 0.45 on Nov 11 and is falling. Buying pressure is still positive but fading quickly. [Accumulation]
- ADX (14): 19.7 and falling, so the trend is weak or range-bound. +DI (29.4) is above −DI (23.6), so bulls hold a slight edge, but the spread has narrowed from about 16 points to about 6. [Weak Trend, slight bullish lean]
- Volume: 234.6K, which is average to below average on recent bars. The bounce from the ~$555 low has not been backed by heavy volume, so conviction is limited. Price is above VWAP ($604.22) by a thin margin. [Neutral to mildly bullish]
DIVERGENCES & TRENDS
- Momentum fade: RSI, MACD histogram, CMF and ADX are all rolling over from their Nov 11–12 peaks while price holds near $605–611. This is a mild bearish divergence in momentum, not a confirmed price divergence.
- Short-term structure: Price has made higher lows since the early November bottom near $555. The EMA13/34 bullish cross and the MACD bullish cross (Nov 11) both remain intact.
- Long-term trend: Price is far below SMA50 ($744.77) and SMA200 ($807.76), with SMA50 below SMA200 (death cross already in place). This is a major bearish backdrop and caps how far the bounce can run. Both SMAs are very far away, so they are not near-term targets.
- Price vs. VWAP and EMAs: Price is pinned right on VWAP and EMA13, and the margin is thin.
CHART PATTERNS
- Possible Bullish Falling Wedge reversal: The multi-week decline narrowed into the early-November low, followed by a breakout. The pattern is in its early stage and is not confirmed by volume.
- Bullish Flag or Pennant continuation: The tight Nov 11–12 range of $602–$611 after the sharp jump from $584 to $609 resembles a small flag. A break above ~$611 would project roughly $625–$630 (flagpole ~$25).
- Failure risk: If price breaks below $597, this becomes a failed bounce in a larger downtrend.
POTENTIAL SCENARIOS
- Scenario 1: Bullish Flag Breakout and Grind Higher — Price holds EMA13/EMA34 support, consolidates, then breaks above the recent $611 high. Trigger: close above $611–612 with CMF stabilizing above 0.05. Target: $621–$625 (upper Bollinger Band). Invalidation: close below $597. (50% probability)
- Scenario 2: Bearish Failed Bounce — Momentum keeps fading, MACD crosses down, and price loses EMA34 and the Bollinger midline, in line with the long-term downtrend. Trigger: close below $597 with a MACD bearish cross. Target: $585–$588, then $573 (lower band). Invalidation: reclaim of $611. (35% probability)
- Scenario 3: Neutral Range Chop — With ADX below 20, price oscillates between $597 and $611 for the full period. Trigger: ADX stays under 20 with no close outside the range. Target: $600–$608. Invalidation: close outside $597–$612. (15% probability)
PRICE TARGETS
- Target Price: $614.00 (8-day horizon, about +1.4%)
- Expected Range: $588.00 to $624.00 (width $36, about 5.9% of price, consistent with the 7–10 day guidance of 4–8%)
- Key Levels: Support at $597.20 (EMA34 and Bollinger midline, with EMA13 at $602.98 as first support), Resistance at $621.30 (upper Bollinger Band, with $611–612 as minor resistance)
OVERALL BIAS
OVERALL BIAS: BULLISH - Price is above EMA13, EMA34 and VWAP, with +DI above −DI, MACD above signal, RSI above 50 and positive CMF. Fading momentum and the long-term downtrend limit the upside, so conviction is modest.
This is educational analysis and not financial advice.