INTC 4-day bearish forecast — Nov 15, 2026
- Bias: Bearish
- Timeframe: 4 days (made Nov 15, 2026, target date Nov 18, 2026)
- Price at analysis: $59.66
- Price target: $58.90
- Expected range: $57.50 – $61.00
- Result: Pending — graded after the close on Nov 18, 2026
Get a free AI analysis of INTC today
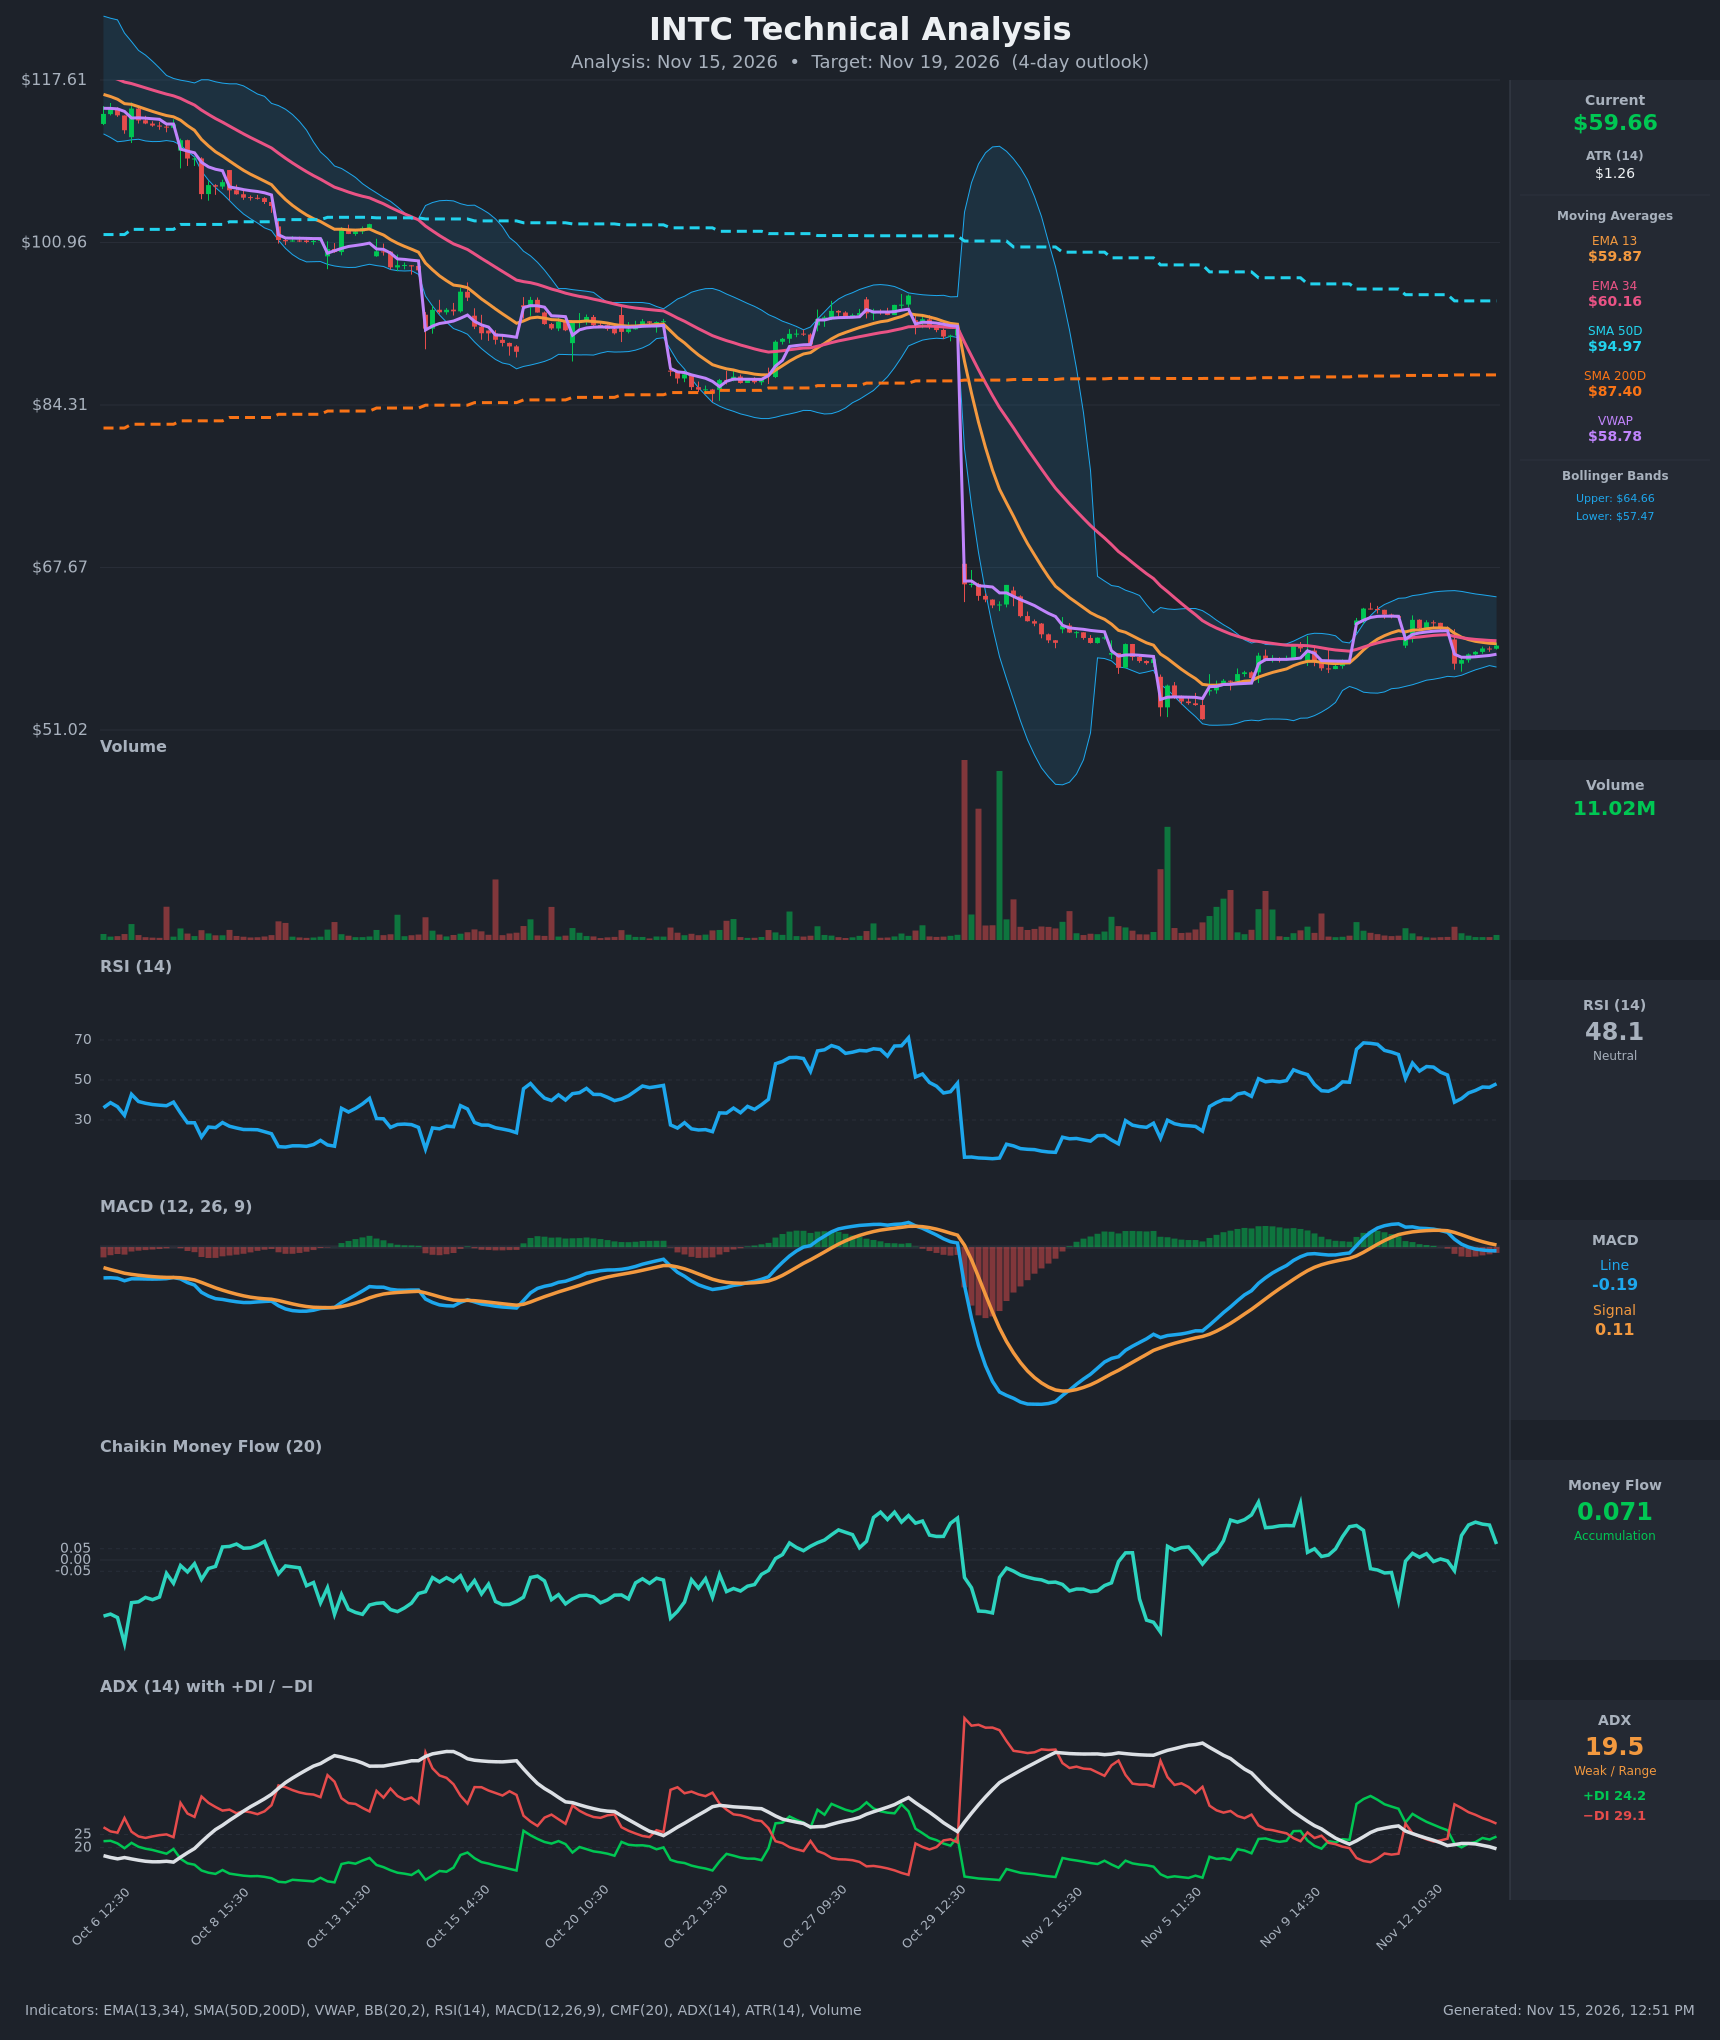
Analysis
TECHNICAL INDICATORS
- RSI (14): 48.10, just under the 50 midline after falling from 62.7 (Nov 11) and bottoming at 38.9 after the Nov 13 gap down. It is recovering but still below 50, so momentum is neutral to slightly soft. [Neutral]
- EMA 13 / EMA 34: EMA13 is $59.87 and EMA34 is $60.16. Price ($59.67) is below both. EMA13 crossed below EMA34 around Nov 13 11:30, a bearish crossover. The EMAs are now overhead resistance. [Bearish]
- MACD: The line is -0.186 against a signal of 0.107, so the histogram is about -0.29. The line crossed below the signal on Nov 12 14:30 and fell through zero on Nov 13 11:30. The gap between line and signal is still widening, so downside momentum has not yet reversed. [Bearish]
- Bollinger Bands (20): The bands run $57.47 to $64.66, with price at $59.67, in the lower half and below the midline (~$61). The bands are fairly wide after the Oct 29 shock but are slowly contracting. Price is not at an extreme, so there is room to drift toward the lower band. [Neutral]
- CMF (20): 0.071 shows mild accumulation, just above the +0.05 threshold. It has faded from 0.168 and is not confirming a strong buying trend. [Accumulation]
- ADX (14): 19.5 and falling, which is weak and range-bound. −DI (29.1) is above +DI (24.2), and bears have held control since the Nov 13 gap. The spread is narrowing (+DI has risen from 20.1 to 24.2). [Weak Trend, bearish lean]
- Volume: 11.02M, with recent bars at average to below-average levels. The bounce from the Nov 13 low came on modest volume, so the recovery has little conviction. [Neutral / weak bounce]
- VWAP: $58.78, with price above it. This is a mild intraday positive and a nearby support area. [Bullish]
- SMA 50D / 200D: SMA50 is $94.97 and SMA200 is $87.40. Price is far below both, a long-term downtrend structure. Both averages are far overhead and irrelevant for a 4-day move except as context. [Bearish]
DIVERGENCES & TRENDS
- No clear price/RSI divergence. RSI rose from 38.9 to 48.1 along with price, so the move is confirmed but still below 50.
- MACD is rolling over (bearish cross, zero-line break) while price has bounced. This is a mild short-term bearish disagreement with the recovery.
- CMF (+0.071) is positive while DI and MACD are bearish. Buying pressure is fading, so the signals conflict. The trend indicators carry more weight here.
- The Nov 13 open gapped from $61.22 down to $57.81. Price has recovered about half the gap, and the gap-fill zone at $60.2–61.2 coincides with EMA34.
- ADX has fallen below 20, so the market is in a range or consolidation phase after the October collapse.
CHART PATTERNS
- Bearish Flag / Rising Channel (continuation): The recovery after the Nov 13 gap down is a gentle upward-sloping channel, with higher lows and slightly higher highs, under the EMA13/34 cluster. A break below the channel low (~$58.80) would target the gap low (~$57.80) and the lower Bollinger Band ($57.47).
- Broader range: Since the Oct 29 crash, price has been basing in roughly a $52–$62 range. Because the range is wide, this works only as context, not a firm reversal pattern. The $60–62 area has capped the recent rallies.
- Failed trend resumption: The Nov 11–12 push to $62.5 was rejected and then gapped down, which weakens the bullish base reading.
POTENTIAL SCENARIOS
- Scenario 1: Bearish Rejection at EMAs, Retest of Gap Low — Price stalls under the EMA13/34 cluster, and the bearish MACD and −DI dominance pull it back below VWAP. Trigger: failure at $60.16 followed by a break below $58.78. Target: $57.80 to $58.00, with a possible wick to the lower band at $57.47. Invalidation: a close above $60.50. (45% probability)
- Scenario 2: Neutral Range Chop — Weak ADX and a fading CMF keep price oscillating between VWAP and the EMAs. Trigger: price holds $58.78–$60.20. Target: $59.00–$60.00. Invalidation: a close below $58.50 or above $60.50. (30% probability)
- Scenario 3: Bullish Gap Fill — CMF accumulation and the VWAP hold push price up through EMA34 to fill the Nov 13 gap. Trigger: a hourly close above $60.20 on rising volume. Target: $61.20 (gap fill), then the mid-Bollinger band near $61. Invalidation: a drop back below $59.00. (25% probability)
PRICE TARGETS
Based on ATR of $1.26, the 4-day expected move is about ±$2.5 at the extremes. A $3.50 range width is about 5.9% of price, which fits the 4-day guidance (between the 2–3 day 2–4% and the 7–10 day 4–8% ranges).
- Target Price: $58.90 (4 days)
- Expected Range: $57.50 to $61.00 (width $3.50 ≈ 5.9%)
- Key Levels: Support at $57.80 (Nov 13 gap low, with VWAP at $58.78 as the first cushion), Resistance at $60.16 (EMA34, then the gap-fill zone near $61.20)
OVERALL BIAS
OVERALL BIAS: BEARISH - Price is below the bearish-crossed EMA13/EMA34, MACD is below signal and zero, and −DI leads +DI, with the bounce rejecting under the $60.16 EMA34. CMF accumulation and the VWAP support temper conviction, so expect a modest pullback toward $58–$59 rather than a breakdown.
This is educational analysis and not financial advice.