INTC 6-day bearish forecast — Nov 15, 2026
- Bias: Bearish
- Timeframe: 6 days (made Nov 15, 2026, target date Nov 20, 2026)
- Price at analysis: $59.66
- Price target: $58.90
- Expected range: $56.80 – $61.00
- Result: Pending — graded after the close on Nov 20, 2026
Get a free AI analysis of INTC today
Analysis
TECHNICAL INDICATORS
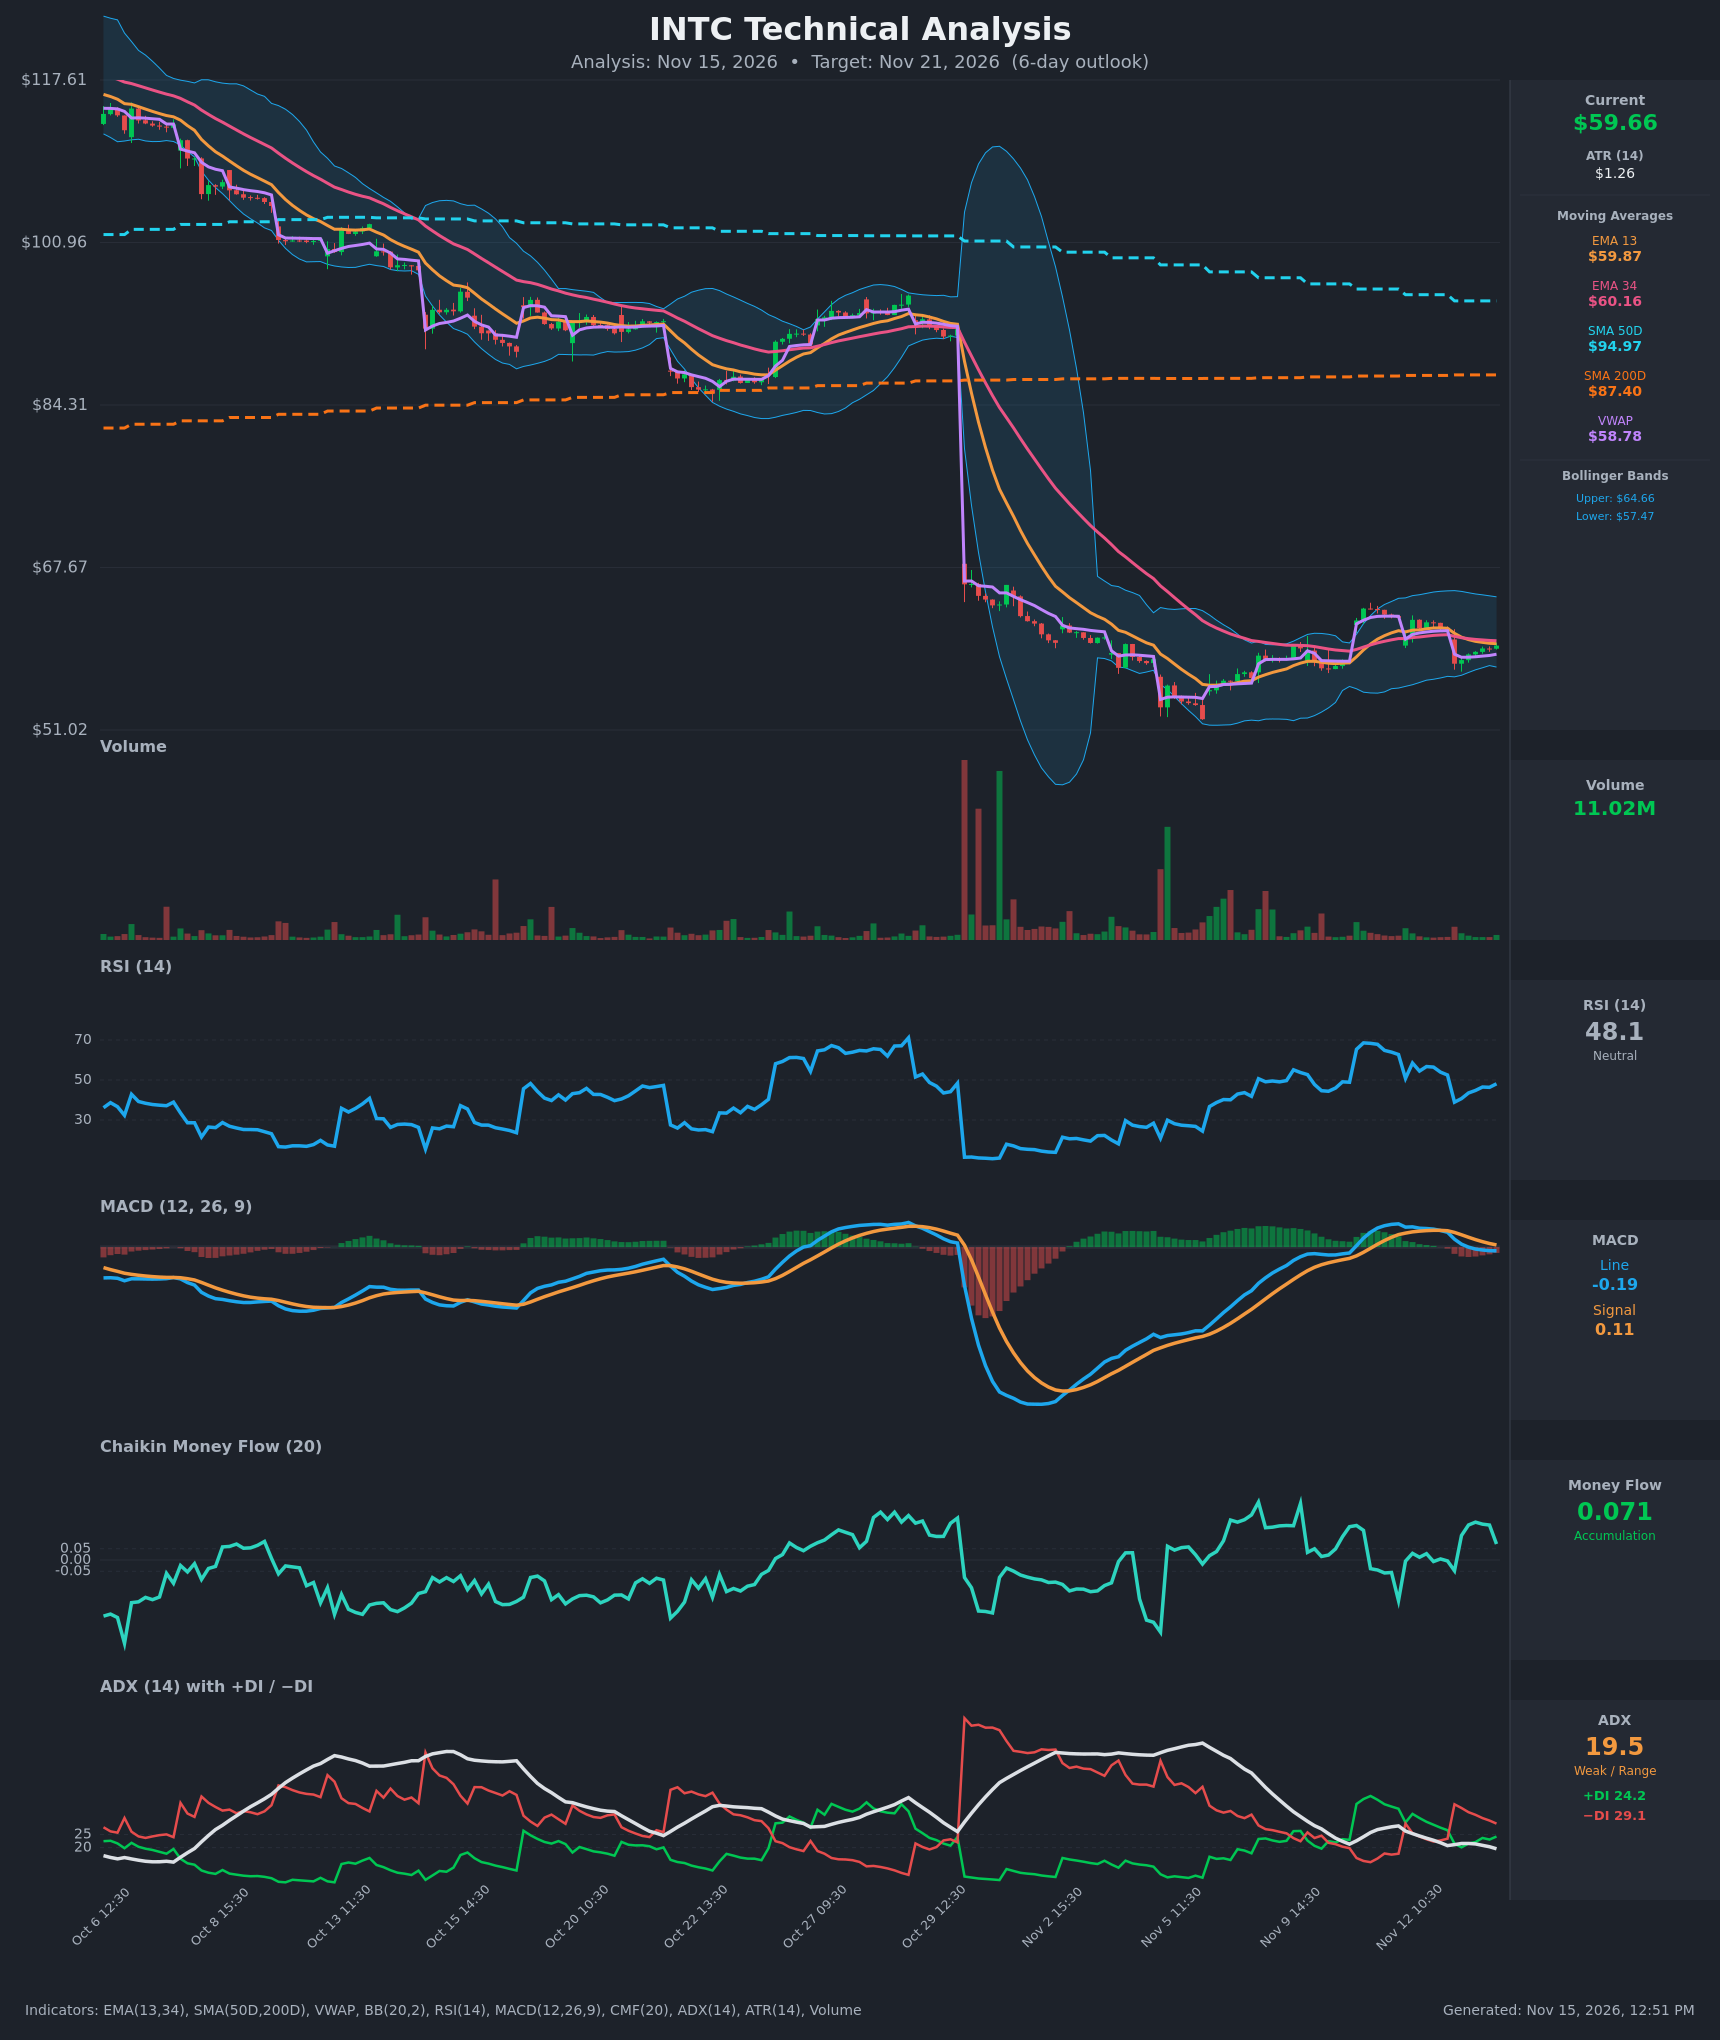
- RSI (14): 48.1, near the midline. It dropped to about 39 after the Nov 13 gap-down and has recovered steadily. Momentum is improving but has not reclaimed 50. [Neutral]
- 20 EMA (EMA 13/34 shown): EMA 13 is $59.87 and EMA 34 is $60.16. Price at $59.67 is below both, and EMA 13 has crossed below EMA 34, so both act as overhead resistance. [Bearish]
- MACD: The line is -0.186 and the signal is +0.107. The line crossed below the signal on Nov 13 and the histogram is negative. The decline is flattening, but there is no bullish re-cross yet. [Bearish]
- Bollinger Bands (20): Upper is $64.66 and lower is $57.47. Price sits just below the midline (about $61) in the lower half of the bands. The bands are modestly wide after the Oct 29 volatility spike. The Nov 13 low of $57.81 tested the lower band and was bought. [Neutral]
- CMF (20): 0.071, above +0.05, but down from about 0.17 earlier on Nov 13. Buying pressure is present but fading. [Accumulation]
- ADX (14): 19.5 and falling, which means a weak trend or range. −DI (29.1) is above +DI (24.2), so bears have a slight edge. [Weak Trend, bearish lean]
- Volume: 11.02M, far below the Oct 29 capitulation spikes. The bounce from $57.81 came on light volume, which suggests low conviction. [Neutral to mildly bearish]
DIVERGENCES & TRENDS
- Price made a lower low on Nov 13 ($57.81) while CMF stayed positive. This is a mild bullish divergence in money flow, but CMF is now rolling over.
- RSI has risen from 38.9 to 48.1 while price is still below the EMAs. This is a relief bounce, not yet a trend change.
- The MACD bearish crossover on Nov 13 came after the earlier positive histogram faded. The MACD line is still falling toward zero.
- EMA 13 crossed below EMA 34 on Nov 13 (about 11:30), a short-term bearish crossover.
- The DI lines flipped bearish on Nov 13 (−DI 36.5 vs +DI 21.5) and the gap has narrowed since. ADX is below 20, so there is no strong trend to follow.
- Price is far below the SMA50D ($94.97) and SMA200D ($87.40), so the long-term trend is firmly down. The SMA50D is still above the SMA200D but is falling toward it, and a death cross is possible in coming weeks.
- Price is above VWAP ($58.78), which gives intraday buyers a short-term support reference.
CHART PATTERNS
- After the Oct 29 collapse from about $91 to about $64 and the slide to about $52, price has stabilized in a $57.5–$62.5 range. This resembles a Bearish Pennant / Flag or a loose Symmetrical Triangle inside a larger downtrend. These patterns usually resolve in the direction of the prior trend, which is down.
- The pattern is not clean. The highs near $62.5 are lower than the earlier $64+ levels, and the lows near $57.5–$58 have held twice.
- A break below $57.47 (the lower band and gap low) would project toward $54–$55. A move above $62.5 would invalidate the bearish pennant read and open a retest of $64.66.
POTENTIAL SCENARIOS
- Scenario 1: Bearish Rejection at EMAs, Retest of Range Low — Price fails at the EMA 13/34 cluster ($59.87–$60.16), MACD stays below its signal and −DI stays on top. Price slips below VWAP and tests the lower band. Trigger: rejection at $60.16 and a close below $58.78 VWAP. Target: $57.50–$58.00. Invalidation: close above $61.00. (45% probability)
- Scenario 2: Bullish Relief Rally Toward Band Midline — CMF accumulation and the rising RSI carry price through the EMAs, and MACD curls up. Trigger: a hold above $60.16 with RSI above 55. Target: $61.50–$62.50. Invalidation: close below $58.00. (30% probability)
- Scenario 3: Neutral Chop Around VWAP/EMAs — With ADX below 20, price oscillates between about $58.50 and $60.50. Trigger: failure to break either $58.78 or $60.16 decisively. Target: $59.00–$60.00. Invalidation: a close beyond $57.80 or $61.50. (25% probability)
PRICE TARGETS
- Target Price: $58.90 (6-day)
- Expected Range: $56.80 to $61.00 (width $4.20, about 7.0% of current price, within the 4–8% guidance for a 6-day horizon)
- Key Levels: Support at $58.78 (VWAP; deeper support at $57.47 lower band), Resistance at $60.16 (EMA 34; then $61.06 band midline)
OVERALL BIAS
OVERALL BIAS: BEARISH - Price is below both EMAs after a bearish MACD crossover, −DI leads +DI, and the long-term trend is firmly down below the SMA50D and SMA200D. CMF accumulation and the hold above VWAP limit the downside, so conviction is modest.
This is educational analysis and not financial advice.