MU 4-day bullish forecast — Nov 15, 2026
- Bias: Bullish
- Timeframe: 4 days (made Nov 15, 2026, target date Nov 18, 2026)
- Price at analysis: $778.40
- Price target: $790.00
- Expected range: $762.00 – $799.00
- Result: Pending — graded after the close on Nov 18, 2026
Get a free AI analysis of MU today
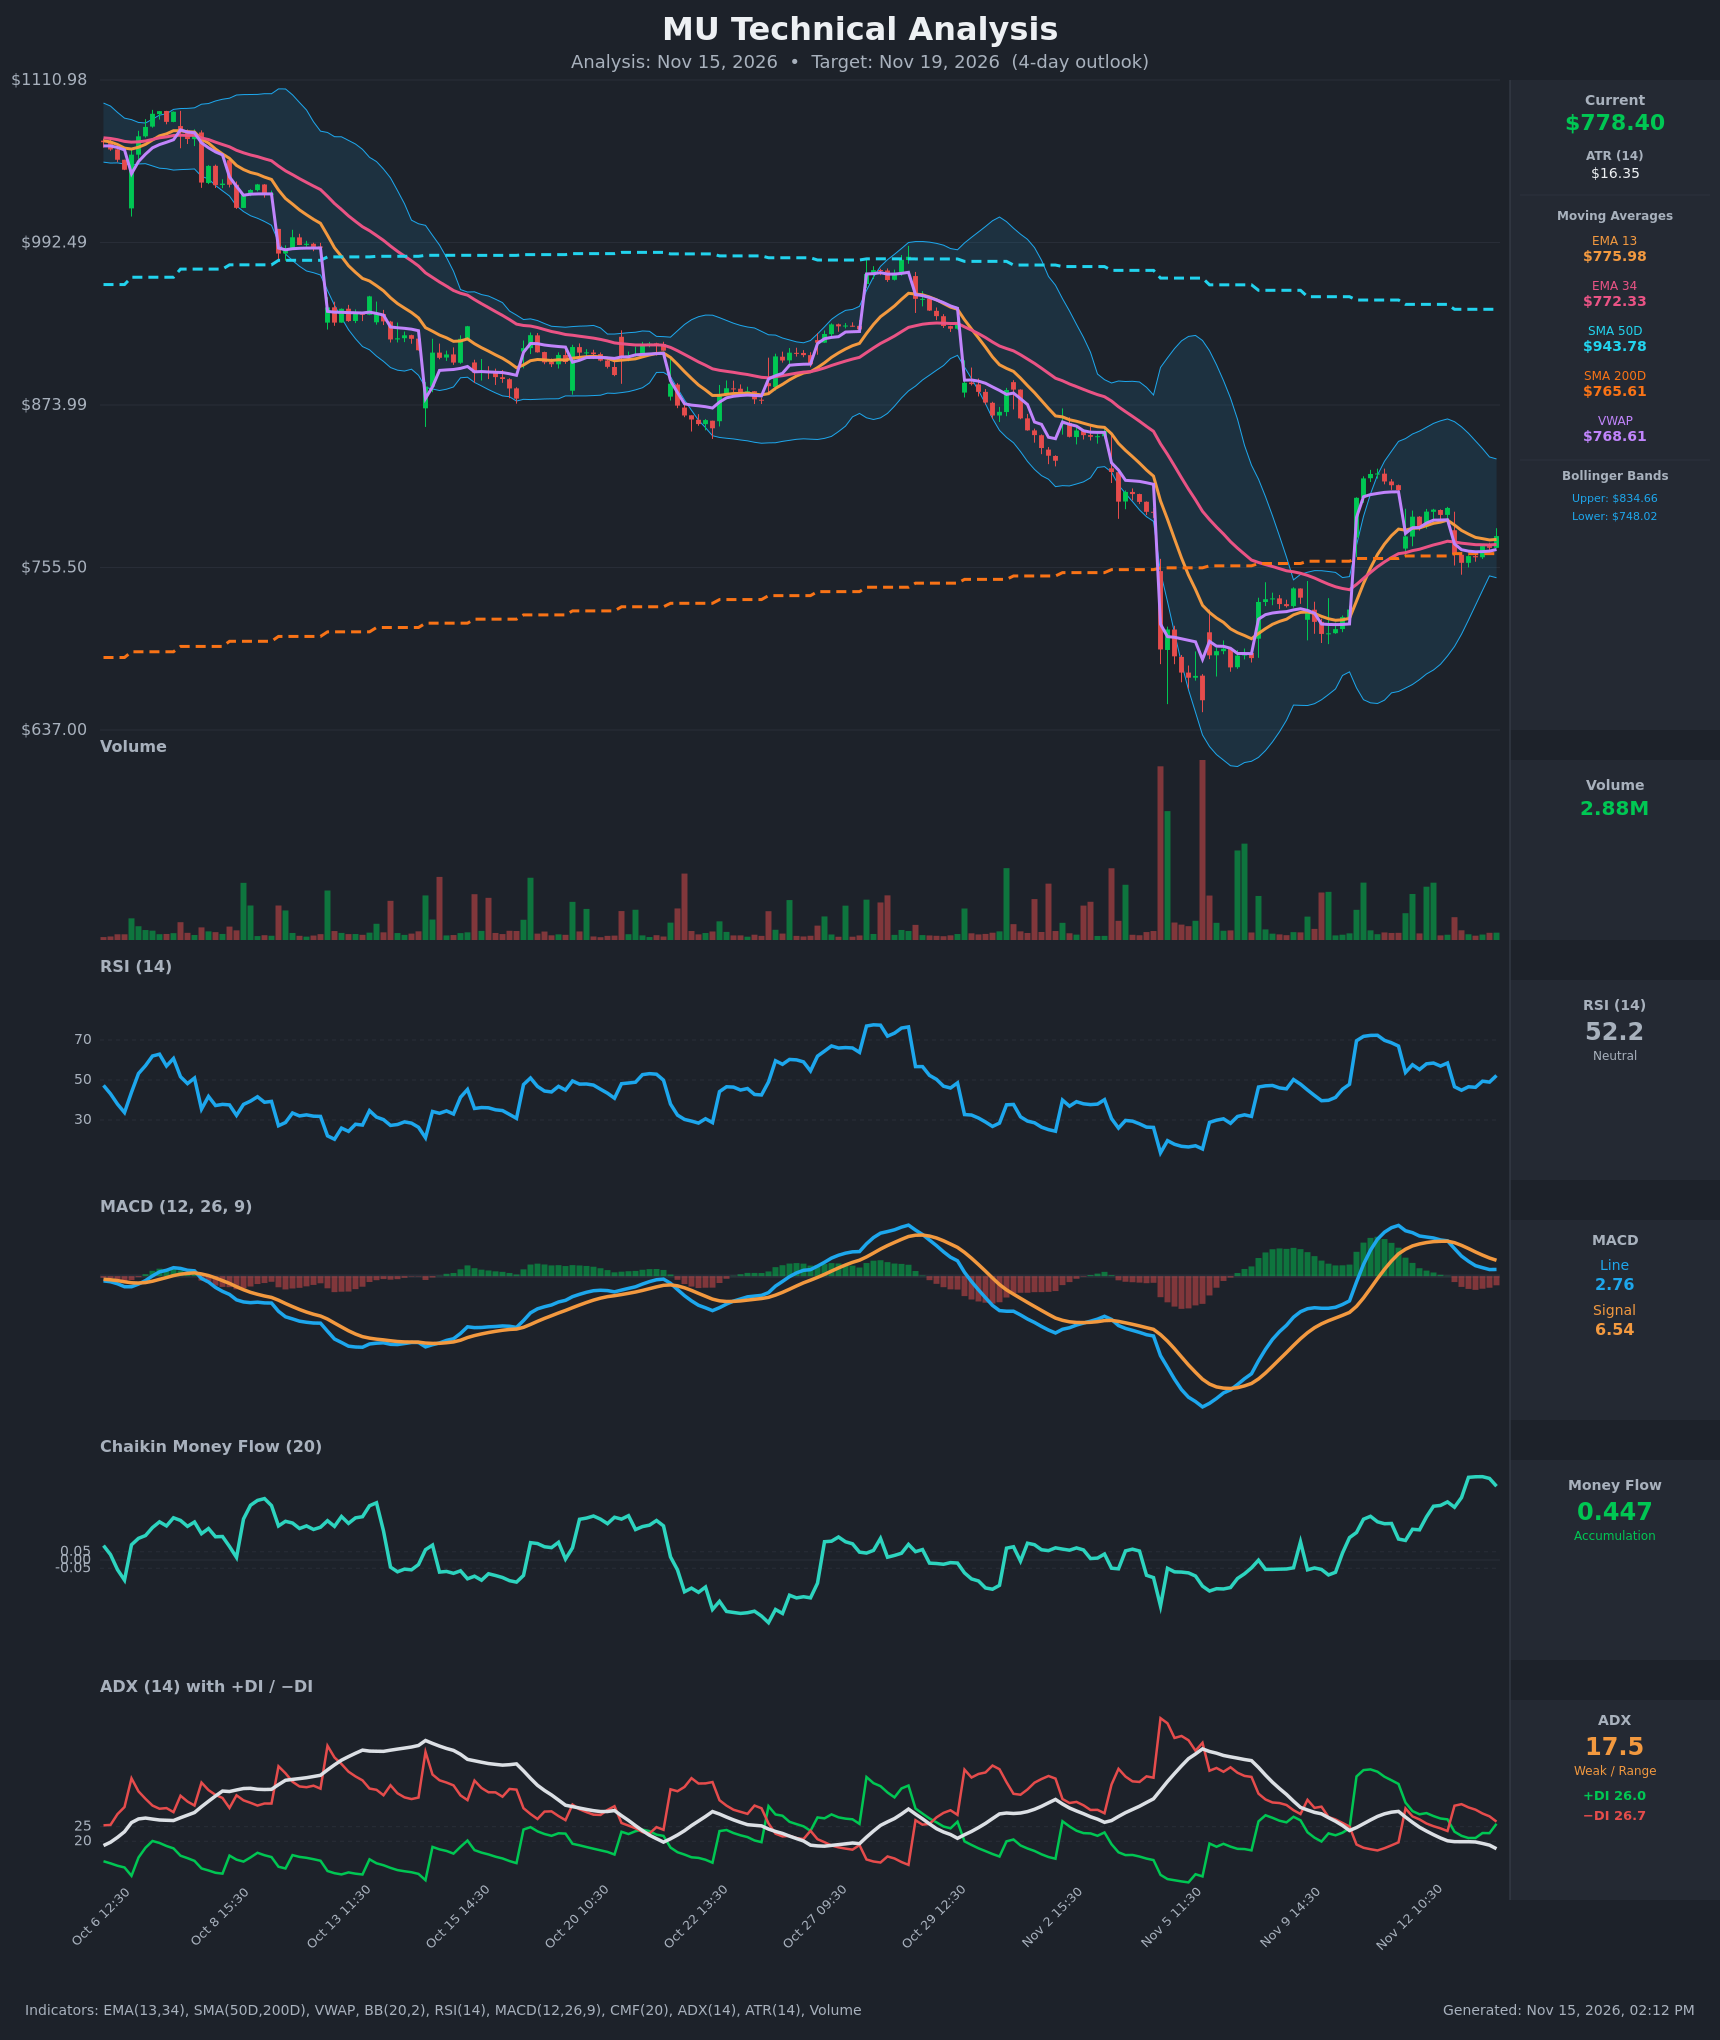
Analysis
TECHNICAL INDICATORS
- RSI (14): 52.25, back near the midline after dipping to about 45 on Nov 13. It has turned up from 44.9 to 52.2 over the last five bars. Momentum is neutral but improving. [Neutral]
- EMA 13 / EMA 34: EMA13 is $775.98 and EMA34 is $772.33. Price at $778.40 sits just above both, and EMA13 is above EMA34 with a narrowing gap. The cluster at $772-776 is near-term support. Price is also above the SMA200 ($765.61) but far below the falling SMA50 ($943.78). [Bullish]
- MACD: Line 2.76, signal 6.54, histogram about -3.8. The line is below the signal after a bearish cross on Nov 13. The line ticked up from 2.719 to 2.759, so downside momentum is fading. A bullish re-cross is possible within a few bars if price holds. [Neutral]
- Bollinger Bands (20): Upper $834.66, lower $748.02, midline about $791. Price is in the lower half of the bands, about 35% of the way from the lower band. The bands are wide after the volatile selloff and bounce. The lower band at $748 and the mid-band at about $791 are the likely boundaries. [Neutral]
- CMF (20): 0.447, well above +0.05 and the highest reading in the chart window. Money flow has been consistently positive since Nov 5. Heavy accumulation is not yet reflected in price, which is a constructive hint. [Accumulation]
- ADX (14): 17.5 and falling, which means weak or range-bound. +DI is 26.0 and −DI is 26.7, so the two are almost equal. +DI has been rising from 21 while −DI falls, so a bullish DI cross is imminent. [Weak Trend – slight bullish shift]
- Volume: 2.88M, light compared with the capitulation spikes around Nov 5-6. The last few sessions show declining volume during consolidation. That is typical of a pause or flag rather than aggressive distribution. [Neutral / consolidation]
DIVERGENCES & TRENDS
- CMF vs price: CMF has risen from about 0.0 to 0.45 while price has moved sideways between about $759 and $799. This is a bullish divergence, with accumulation under the surface.
- MACD: Bearish crossover on Nov 13, but both lines are still above zero and the gap is flattening.
- DIs: +DI is converging on −DI after a bearish excursion. A bullish cross would confirm an upturn, though ADX below 20 means any move may lack follow-through.
- Moving averages: SMA50 ($943.78) is far above SMA200 ($765.61) and falling. No cross is imminent, but the larger trend since October is down.
- VWAP: Price is about $10 above VWAP ($768.61), a mild intraday buyer edge.
- Price structure: After the Nov 5-6 capitulation low near $650-660, price made a higher low near $700, gapped up to about $812, then pulled back to the $759-799 range. Support is holding on the SMA200 and EMA cluster.
CHART PATTERNS
- Bullish flag / pennant (continuation): The gap-up impulse from about $710 to $812 was followed by a tight, low-volume consolidation with slightly lower highs. A break above about $799-$812 would project a measured move toward $830-$835, which is the upper Bollinger Band area.
- Larger context: The broader picture is a downtrend from about $1,080 with a possible base forming (a bullish falling-wedge or double-bottom-type reversal). It is not confirmed while price remains well below the SMA50.
- Bearish alternative: A close below $758-$765 would break the flag and SMA200 support. That opens a move to the lower band at about $748, then toward $720.
POTENTIAL SCENARIOS
- Scenario 1: Bullish Flag Breakout / Grind Higher — Accumulation (CMF 0.45), the DI cross and a MACD re-cross lift price above the EMA cluster and the mid-band. Trigger: close above $799 with rising volume. Target: $805-$812, with an extension to about $830. Invalidation: close below $765. (45% probability)
- Scenario 2: Bearish Breakdown of Support — The long-term downtrend reasserts itself, MACD stays below its signal and −DI regains the lead. Trigger: close below $765.61 (SMA200) and $759. Target: $748, then $730. Invalidation: reclaim of $785. (30% probability)
- Scenario 3: Neutral Range Chop — ADX stays under 20 and price oscillates around the EMAs and VWAP. Trigger: failure to clear $799 or break $759. Target: $765-$795. Invalidation: close outside $755-$805. (25% probability)
PRICE TARGETS
- Target Price: $790.00 (4-day, about +1.5%, roughly 0.7 ATR drift toward the Bollinger midline)
- Expected Range: $762.00 to $799.00 (width $37, about 4.8% of price, consistent with a 4-day window and ATR of $16.36)
- Key Levels: Support at $765.61 (SMA200, with the EMA cluster just above at $772-$776), Resistance at $811.95 (recent swing high)
OVERALL BIAS
OVERALL BIAS: BULLISH - Strong CMF accumulation (0.447), price holding above the EMA13/34, SMA200 and VWAP, and a +DI/−DI cross in progress favor a modest upside drift. Conviction is limited by weak ADX (17.5), MACD below its signal and the far-overhead SMA50.
This is educational analysis and not financial advice.