MU 6-day bullish forecast — Nov 15, 2026
- Bias: Bullish
- Timeframe: 6 days (made Nov 15, 2026, target date Nov 20, 2026)
- Price at analysis: $778.40
- Price target: $793.00
- Expected range: $755.00 – $805.00
- Result: Pending — graded after the close on Nov 20, 2026
Get a free AI analysis of MU today
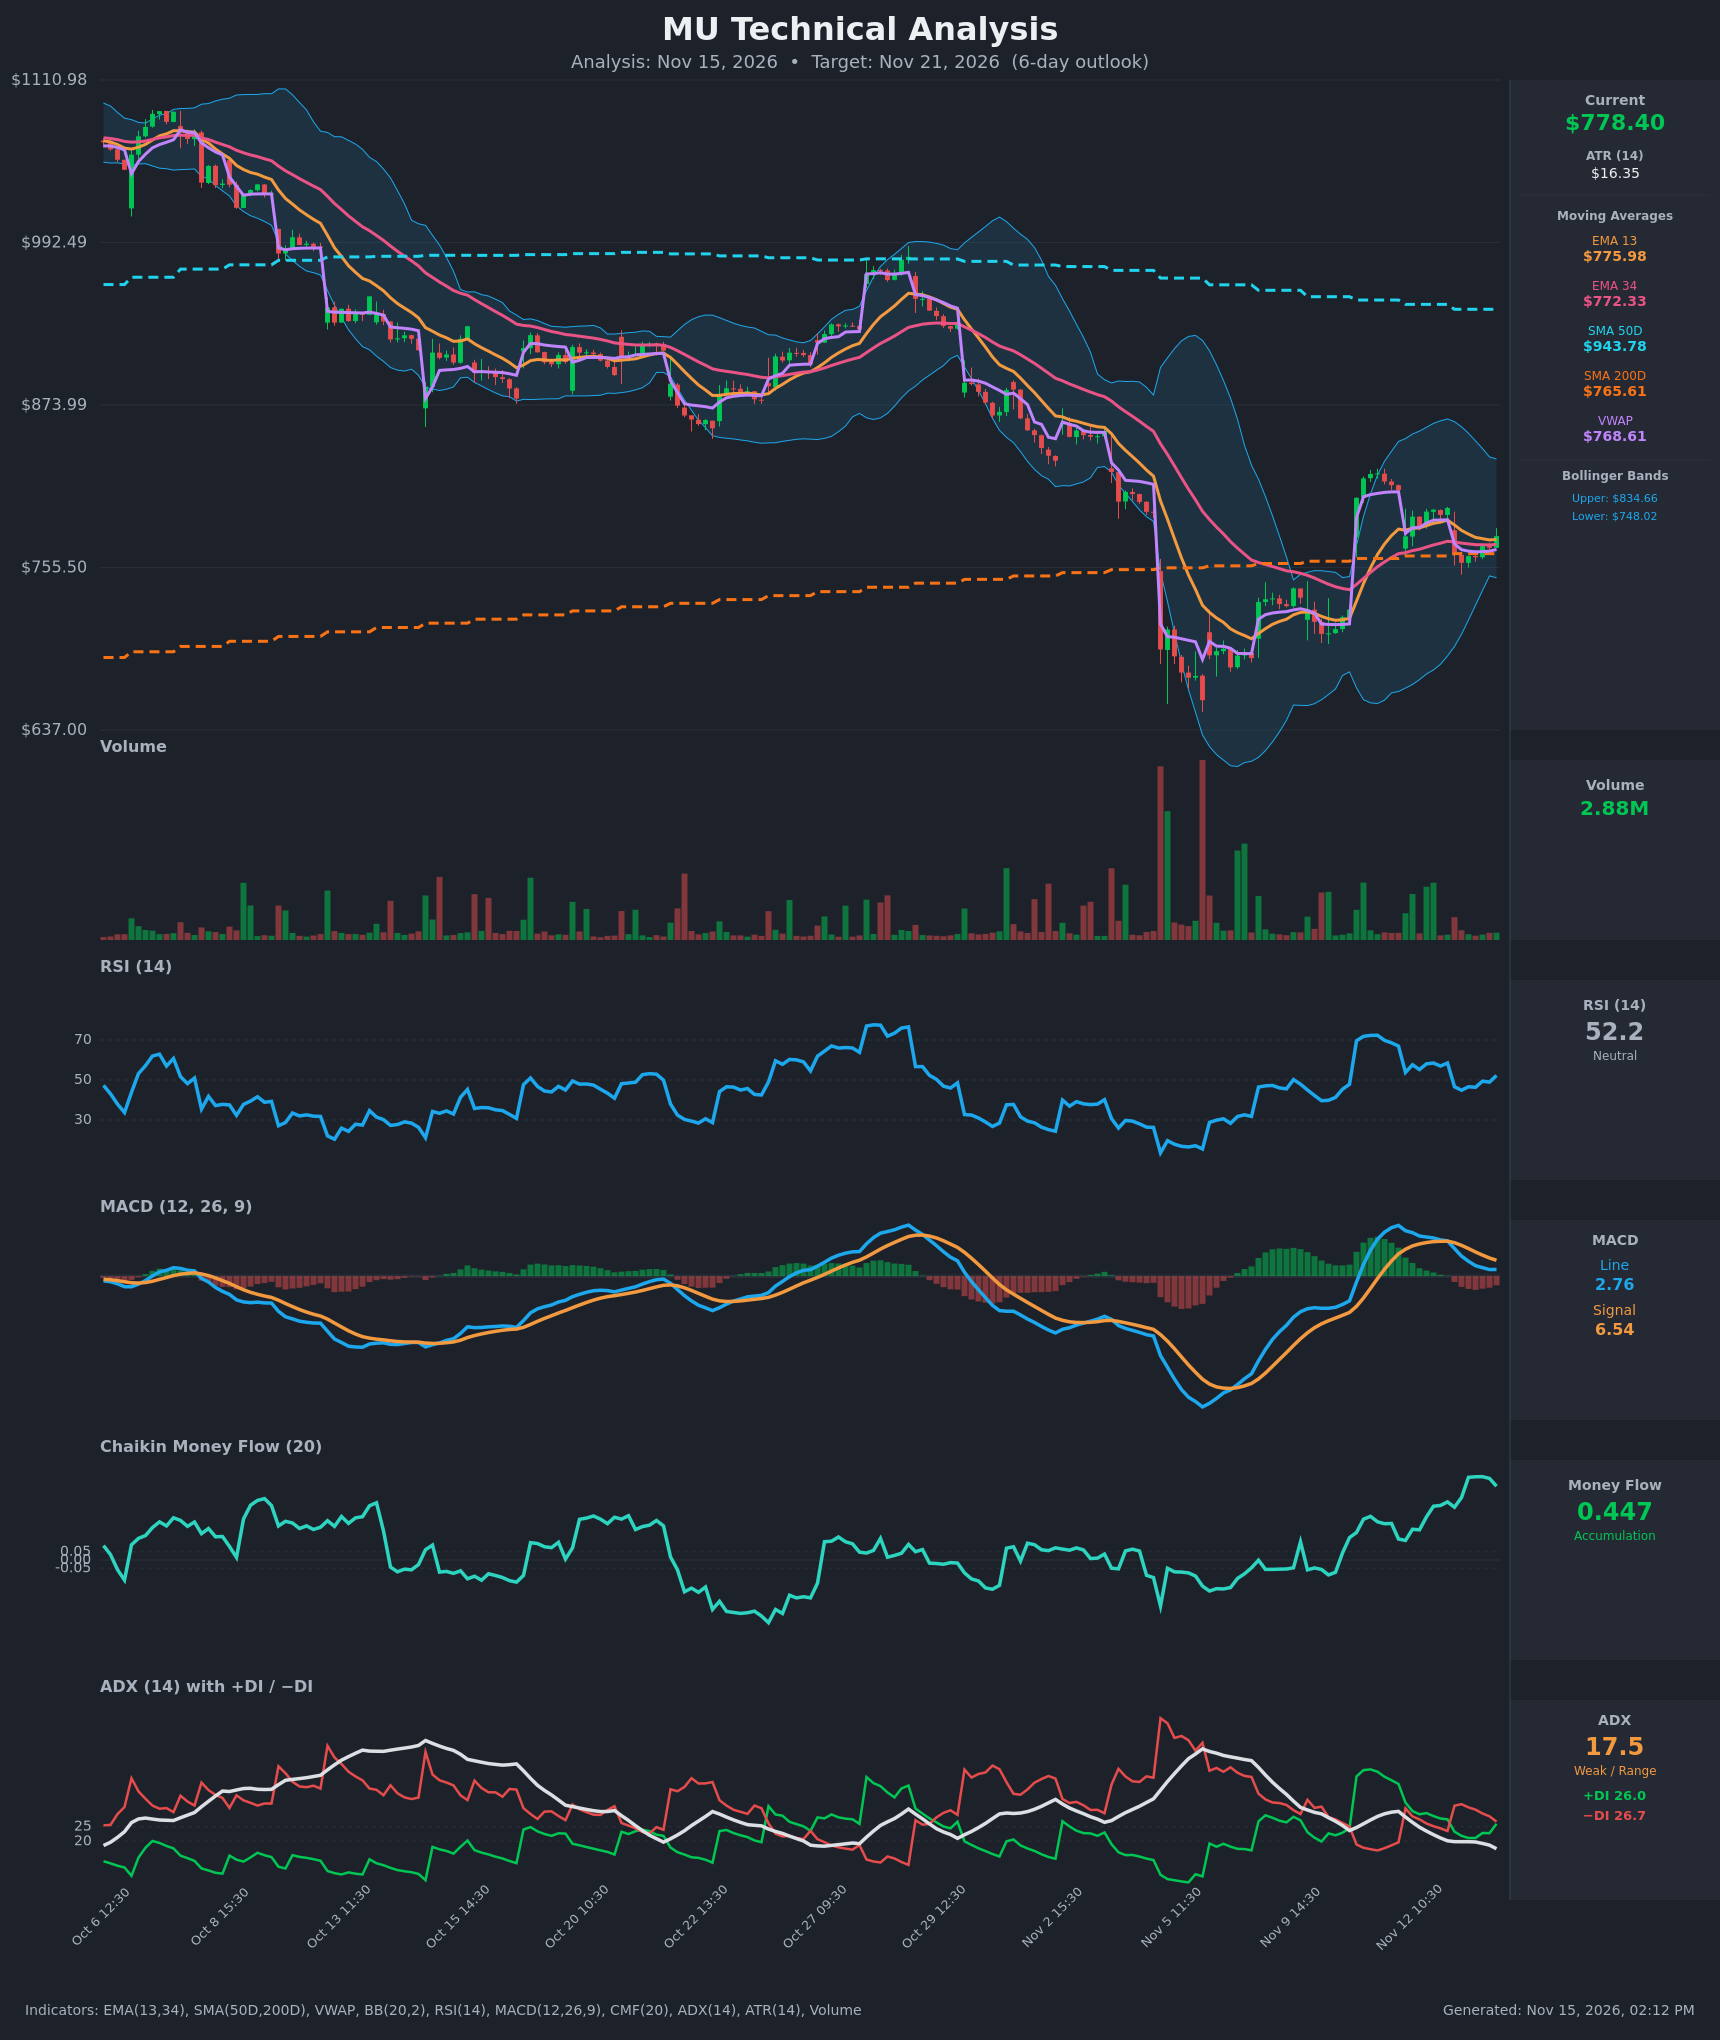
Analysis
TECHNICAL INDICATORS
- RSI (14): 52.25, up from a low of 44.9 on Nov 13 and back above the 50 midline. Momentum is turning up from neutral, with no overbought or oversold signal. [Neutral]
- 20 EMA (EMA 13/34 supplied): EMA 13 is $775.98 and EMA 34 is $772.33. Price at $778.40 sits just above both, and EMA 13 is above EMA 34, so the short-term structure is still bullish. The gap is narrowing, so support is thin. [Bullish]
- MACD: The line (2.76) is below the signal (6.54), a bearish crossover that happened on Nov 13. The histogram is negative but shrinking, and the line has flattened (2.72 to 2.76). Downside momentum is fading, but there is no bullish cross yet. [Bearish]
- Bollinger Bands (20): Upper is $834.66, lower is $748.02, and the midline is about $791. Price is in the lower half of the bands, and the bands are contracting after a volatile move. Price is above the lower band and below the mid, which is a mild pullback within a range. [Neutral]
- CMF (20): 0.447, strongly above +0.05 and near the top of its recent range. Buying pressure has built steadily while price has drifted sideways to lower, which suggests quiet accumulation. [Accumulation]
- ADX (14): 17.5 and falling, which means a weak or range-bound trend. +DI (26.0) is almost level with −DI (26.7), and +DI is rising while −DI is falling, so a bullish DI cross looks imminent. [Weak Trend, direction undecided with a bullish tilt]
- Volume: 2.88M, light compared with the capitulation and rebound spikes in early November. Volume is drying up during the consolidation, which is typical of a flag or pause rather than active distribution. [Neutral, consolidation]
Other levels:
- Price is above SMA200D ($765.61), which is the key floor.
- Price is above VWAP ($768.61).
- Price is far below SMA50D ($943.78), so the longer-term trend remains down and the 50D is overhead resistance.
DIVERGENCES & TRENDS
- Bullish CMF divergence: CMF has climbed from about 0.12 to 0.45 while price has gone sideways to slightly lower since the Nov 11 peak ($812). This points to accumulation.
- MACD: It has crossed bearishly, but the histogram contraction and flat line show momentum decay on the downside rather than a fresh impulse lower.
- RSI: It made a higher low (about 45 on Nov 13) after the 67 peak, and it is now recovering toward 52.
- DI lines: −DI dominated on Nov 13 but has rolled over. +DI is crossing back up, so a bullish cross is likely.
- Long-term trend: The SMA50D is falling far above price (about 21% above) and the SMA200D is rising. A death cross is not in place, but the chart shows a major downtrend from about $1,080 down to $650, followed by a V-shaped bounce.
- Support test: Price is stalled in the confluence of the SMA200D, VWAP and the EMAs ($765–776). This is a decision zone.
CHART PATTERNS
- Bullish Flag / Pennant (continuation): After the sharp impulse from about $700 to $830, price has consolidated in a tight, slightly downward-sloping range of about $758–$812. Volume is contracting, as expected in a flag. A breakout above about $800–$812 would project toward the Bollinger upper band at about $835 and then the $850 area.
- Possible Symmetrical Triangle / range: The highs and lows are compressing, and ADX is below 20. The break can go either way, but accumulation (CMF) favors an upside resolution.
- Bearish risk: A close below the SMA200D and the $758 swing low would invalidate the flag and open the lower band at $748 and then the $700–$720 area.
POTENTIAL SCENARIOS
- Scenario 1: Bullish Flag Breakout — Accumulation (CMF 0.45) and a pending bullish DI cross lead price to resolve the consolidation higher, with MACD histogram turning positive. Trigger: hourly close above about $800 with a volume uptick. Target: $795–$812 first, with an extension to $835 (upper band). Invalidation: close below $765 (SMA200D). (50% probability)
- Scenario 2: Neutral Range Chop — Weak ADX and compressed bands keep price oscillating between the SMA200D and the $800 area, with the EMAs and VWAP acting as magnets. Trigger: failure to clear $800 and failure to lose $765. Target: $770–$790. Invalidation: a decisive break of either $765 or $812. (20% probability)
- Scenario 3: Bearish Breakdown — The bearish MACD cross and the lingering long-term downtrend (far below the SMA50D) lead to a loss of the SMA200D/EMA cluster, followed by a flush to the lower band. Trigger: hourly close below $758–$765. Target: $748, then $725. Invalidation: reclaim of $785 on volume. (30% probability)
PRICE TARGETS
Timeframe: 6 days (target date Nov 21, 2026). The range width of about $50 is about 6.4% of the current price, which fits the 4–8% guidance for this horizon.
- Target Price: $793.00
- Expected Range: $755.00 to $805.00 (width $50, about 6.4%)
- Key Levels: Support at $765.61 (SMA200D), Resistance at $812.00 (Nov 11 swing high / flag top)
OVERALL BIAS
OVERALL BIAS: BULLISH - CMF shows strong accumulation (0.447) during a low-volume flag-like consolidation. Price holds above the EMAs, VWAP and SMA200D, the MACD histogram is contracting, and a bullish +DI/−DI cross is imminent. Conviction is modest because MACD is below its signal, ADX is weak, and the SMA50D overhead keeps the longer-term trend bearish.
This is educational analysis and not financial advice.