ASTS 4-day bearish forecast — Nov 15, 2026
- Bias: Bearish
- Timeframe: 4 days (made Nov 15, 2026, target date Nov 18, 2026)
- Price at analysis: $32.60
- Price target: $31.80
- Expected range: $30.20 – $33.70
- Result: Pending — graded after the close on Nov 18, 2026
Get a free AI analysis of ASTS today
Analysis
TECHNICAL INDICATORS
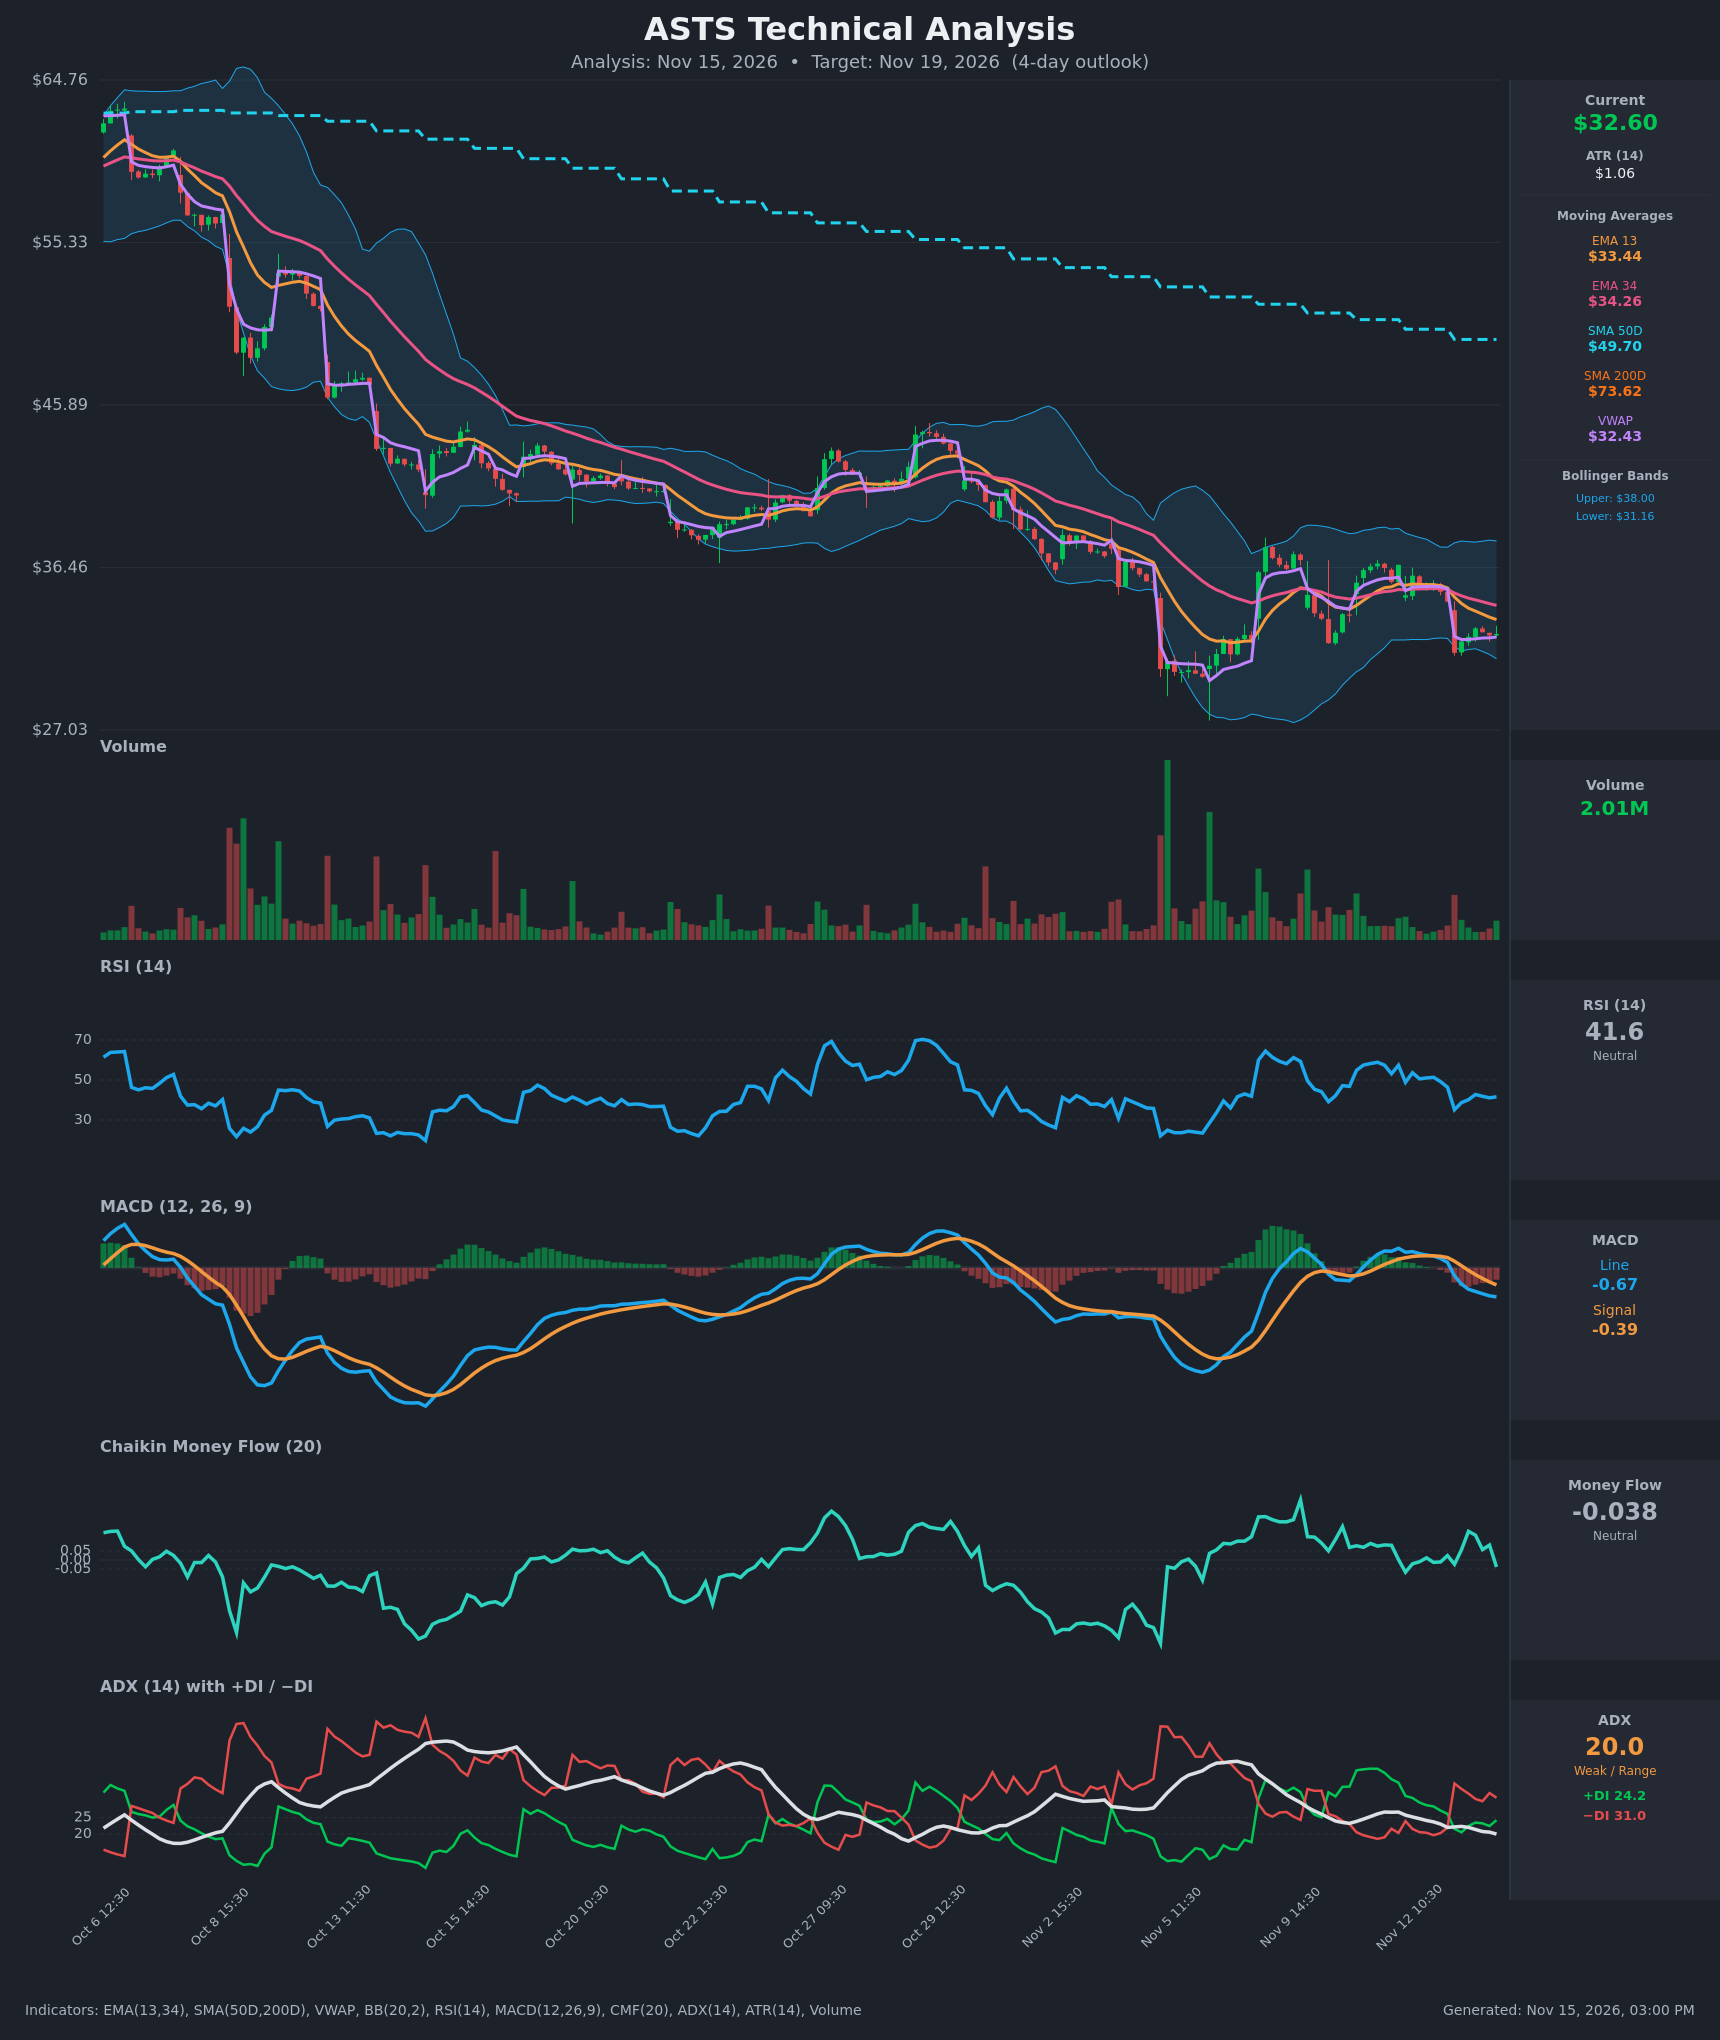
- RSI (14): 41.59, below the 50 midline and recovering slightly from the 35.1 low on Nov 13. It is not oversold, so there is room for further downside, and momentum remains weak. [Bearish]
- 20 EMA: The chart supplies EMA 13 ($33.44) and EMA 34 ($34.26). Price at $32.60 is below both, and both are sloping down. EMA13 is below EMA34 (a bearish alignment), so the EMAs act as overhead resistance. [Bearish]
- MACD: Line -0.669, signal -0.395, histogram about -0.27 and widening. The bearish crossover occurred on Nov 13 at 11:30 and the line is still falling away from the signal. [Bearish]
- Bollinger Bands (20): Upper $38.00, lower $31.16, midline about $34.58. Price at $32.60 sits in the lower third of the bands, about $1.44 above the lower band, so it is neither stretched nor at a bounce point. The bands are moderately wide after the Nov 13 gap down. [Bearish]
- CMF (20): -0.038, inside the neutral band (±0.05). It has rolled over from +0.156 and is trending toward distribution. [Neutral]
- ADX (14): 20.0 and falling, so the trend is weak and borderline range-bound. −DI (31.0) is above +DI (24.2), which gives the bears a directional edge. The −DI crossover on Nov 13 was a bearish shift. [Weak Trend, Bearish lean]
- Volume: 2.01M, quiet and below the spikes seen during the earlier selloffs. The gap-down bar on Nov 13 was heavier, and the follow-through bounce came on light volume, which suggests weak buying conviction. [Neutral to Bearish]
Other context:
- VWAP: $32.43. Price is just above it ($32.60), a minor short-term support.
- SMA50D / SMA200D: $49.70 and $73.62. Price is far below both, and the death cross is long established, so the long-term trend is firmly down.
DIVERGENCES & TRENDS
- No clear bullish divergence. RSI's 35.1 low on Nov 13 was not retested, but price has only made a modest bounce and RSI is still below 50.
- MACD turned negative and is widening. Its bearish crossover on Nov 13 confirms the breakdown from the Nov 12 range ($35-36).
- The EMA13/EMA34 spread is widening, with EMA13 below EMA34, which points to persistent downward pressure.
- ADX is fading from 26.6 to 20.0 while −DI dominates, so the trend is decelerating. This favors a sideways grind or a bounce attempt rather than an accelerating selloff.
- The macro downtrend is intact: lower highs from $64 to $36, with the 50-day SMA still falling.
- Price has held the $31-32 area after the gap, and a nearby prior low around $29-30 exists (early Nov).
CHART PATTERNS
- Bearish Flag / Pennant (small): Following the sharp drop on Nov 13, price has been drifting sideways to slightly higher on light volume. This resembles a bearish flag/pennant, with a measured-move target toward the $29-30 area if support breaks.
- Broader context: A multi-week descending channel with lower highs. Price has been consolidating between about $30 and $38 since early November, which looks like a loose range or base.
- No reliable reversal pattern is confirmed. A bullish falling wedge is not evident.
POTENTIAL SCENARIOS
- Scenario 1: Bearish Flag Breakdown — Price fails at the EMA13 ($33.44) and the bounce fades. A drop below VWAP and the lower band opens a measured move toward the early-November lows. Trigger: close below $31.15 (lower BB). Target: $29.80-$30.50. Invalidation: close above $34.30 (EMA34). (50% probability)
- Scenario 2: Neutral Chop Under Resistance — Weak ADX and neutral CMF keep price in a $31.2-$33.8 range, with VWAP acting as a magnet. Trigger: holds above $31.15 and fails at EMA13. Target: $32.00-$33.00. Invalidation: close outside $31.0-$34.0. (25% probability)
- Scenario 3: Bullish Relief Bounce — A bounce from the lower Bollinger area back to the EMAs as the gap partially fills. Trigger: reclaim of $33.45 (EMA13) on rising volume. Target: $34.30-$35.00. Invalidation: close below $31.50. (25% probability)
PRICE TARGETS
Timeframe: 4 days. The ATR of $1.06 implies roughly a $2.1-2.5 typical move over 4 days. The range width is $5.0 / $32.60 = about 15.3%, which is wider than the 7-10 day guidance. I narrow it to the 4-day band of about 5-7%: $30.90 to $33.90 is $3.00, or 9.2%. That is still wide for 4 days, but it is justified by ATR (3.25% daily) and the elevated volatility after the gap. This is the final range.
- Target Price: $31.80
- Expected Range: $30.20 to $33.70
- Key Levels: Support at $31.16, Resistance at $33.44
OVERALL BIAS
OVERALL BIAS: BEARISH - Price is below both EMAs with a bearish MACD crossover, −DI above +DI, RSI below 50, and a flag-like consolidation after a gap-down. The long-term downtrend (below falling 50/200-day SMAs) adds weight, though weak ADX and neutral CMF keep conviction modest.
This is educational analysis and not financial advice.