ASTS 6-day bearish forecast — Nov 15, 2026
- Bias: Bearish
- Timeframe: 6 days (made Nov 15, 2026, target date Nov 20, 2026)
- Price at analysis: $32.60
- Price target: $31.60
- Expected range: $29.60 – $34.20
- Result: Pending — graded after the close on Nov 20, 2026
Get a free AI analysis of ASTS today
Analysis
TECHNICAL INDICATORS
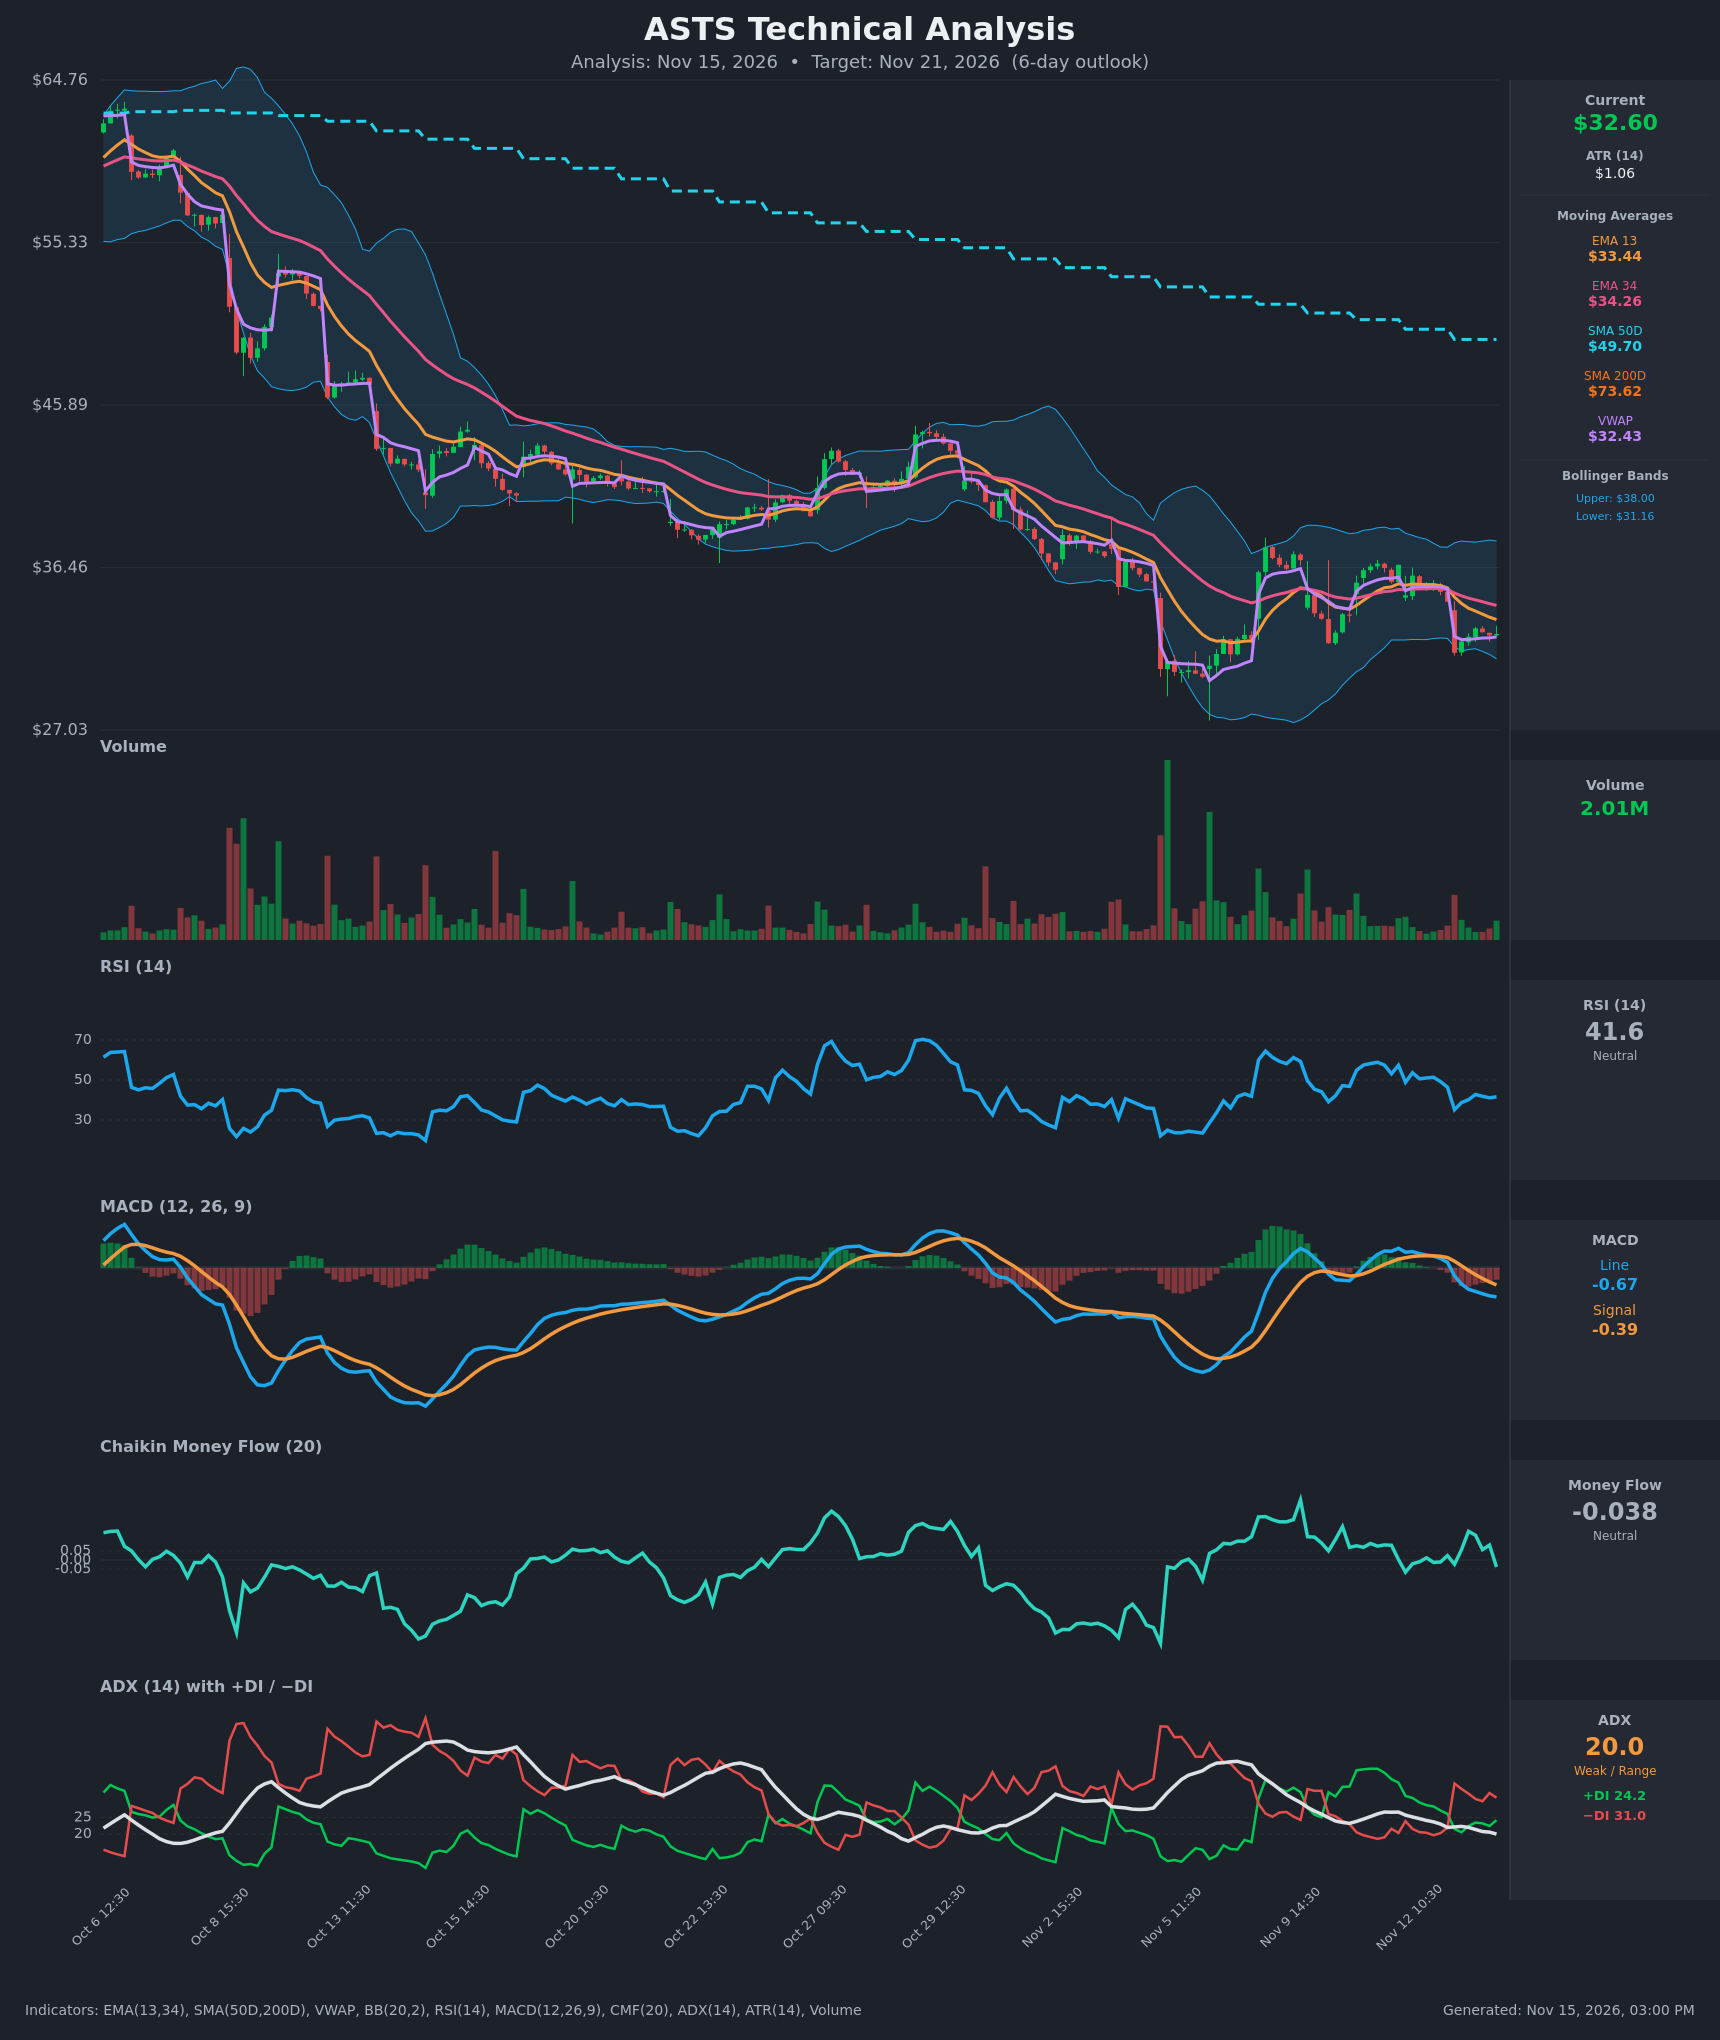
- RSI (14): 41.59, below the 50 midline and up from 35.1 on the Nov 13 open gap-down. It is not oversold, and momentum has stalled in the low 40s. [Bearish]
- 20 EMA: The chart uses EMA 13 ($33.44) and EMA 34 ($34.26). Price at $32.60 is below both, and the EMAs are sloping down and acting as overhead resistance. EMA13 is below EMA34, a bearish alignment. [Bearish]
- MACD: Line -0.669 is below Signal -0.395, a bearish crossover that happened on Nov 13 around 11:30. Both lines are below zero and the histogram is negative and widening. [Bearish]
- Bollinger Bands (20): Upper $38.00, lower $31.16, so price at $32.60 sits in the lower third of the band. The bands are fairly flat and contracting after the earlier expansion. Price is not at the lower band, so there is some room to test it. [Neutral]
- CMF (20): -0.038, in the neutral zone (±0.05). It was positive mid-session on Nov 13 (up to +0.156) and has faded back below zero, which shows weak, inconsistent buying. [Neutral]
- ADX (14): 20.0 and falling, with -DI 31.0 above +DI 24.2. The trend is weak, but the bears have control after the DI crossover on Nov 13. [Weak Trend, Bearish lean]
- Volume: 2.01M, which is modest and below the spikes seen on prior selloffs. The Nov 13 gap-down came with only average participation, and there are no signs of capitulation. [Neutral to mildly bearish]
Other context:
- SMA50D / SMA200D: $49.70 and $73.62. Price is far below both, and the 50D is far below the 200D (a death cross long since in place). This is a deeply entrenched long-term downtrend. [Bearish]
- VWAP: $32.43. Price is just above it, which gives slight intraday support. [Neutral]
DIVERGENCES & TRENDS
- There is no clear divergence. RSI printed higher lows from 35 to 41 while price made a marginal low, but this is not significant.
- The MACD bearish crossover on Nov 13 and the -DI/+DI flip confirm the shift in control after the gap-down from $34.48 to $31.51.
- The EMA13 < EMA34 stack and the descending SMA50D show persistent lower highs and lower lows since early October.
- ADX has drifted down from the mid-20s to 20, so the trend is losing strength. This suggests consolidation or a bounce attempt rather than an acceleration lower.
- Price recovered only to $32.93 after the gap, and EMA13 at $33.44 is a nearby cap.
CHART PATTERNS
- Bearish Pennant / Flag: After the sharp gap-down, price is consolidating in a narrow band around $31.5–$33, which fits a small bearish continuation setup. A break below $31.16 to $31.50 would have a measured target near $29.5–$30.
- Larger structure: A multi-week descending channel with lower highs. The Nov 5 low near $29–$30 is a key support zone, and the $35.5–$36 area is the prior breakdown level.
- The pattern is not fully confirmed, and a rebound to the EMAs is possible before the next leg.
POTENTIAL SCENARIOS
- Scenario 1: Bearish Continuation Breakdown — Price fails at the EMA13 and breaks the lower Bollinger Band, continuing the downtrend as the MACD stays negative and -DI dominates. Trigger: close below $31.16 on rising volume. Target: $29.80–$30.50 (the Nov 5 low zone). Invalidation: close above $34.30 (EMA34). (50% probability)
- Scenario 2: Neutral Range Chop — Price oscillates between the lower band and the EMA13 as ADX stays near 20. Trigger: holds $31.2–$33.5 with low volume. Target: $32.0–$33.0. Invalidation: close outside $31.0–$34.0. (25% probability)
- Scenario 3: Bullish Relief Bounce — A mean-reversion bounce off the lower band and VWAP back toward the EMAs, supported by RSI turning up from the low 40s. Trigger: reclaim of $33.45 (EMA13). Target: $34.30–$35.30. Invalidation: loss of $31.50. (25% probability)
PRICE TARGETS
- Target Price: $31.60 (6-day)
- Expected Range: $29.60 to $34.20 (width $4.60, about 14% of current price; consistent with the roughly 7–14% guidance for a 6-day horizon given ATR of $1.06 and ASTS volatility)
- Key Levels: Support at $31.16 (lower Bollinger Band), Resistance at $33.44 (EMA13)
OVERALL BIAS
OVERALL BIAS: BEARISH - Price is below all key moving averages, with a bearish MACD crossover and -DI above +DI. The long-term downtrend is intact (price far below SMA50D and SMA200D), and rebounds are likely to be capped at EMA13/EMA34. The weak ADX and neutral CMF limit conviction, so the expected downside is modest.
This is educational analysis and not financial advice.