META 4-day bullish forecast — Nov 15, 2026
- Bias: Bullish
- Timeframe: 4 days (made Nov 15, 2026, target date Nov 18, 2026)
- Price at analysis: $641.99
- Price target: $648.50
- Expected range: $630.00 – $660.00
- Result: Pending — graded after the close on Nov 18, 2026
Get a free AI analysis of META today
Analysis
TECHNICAL INDICATORS
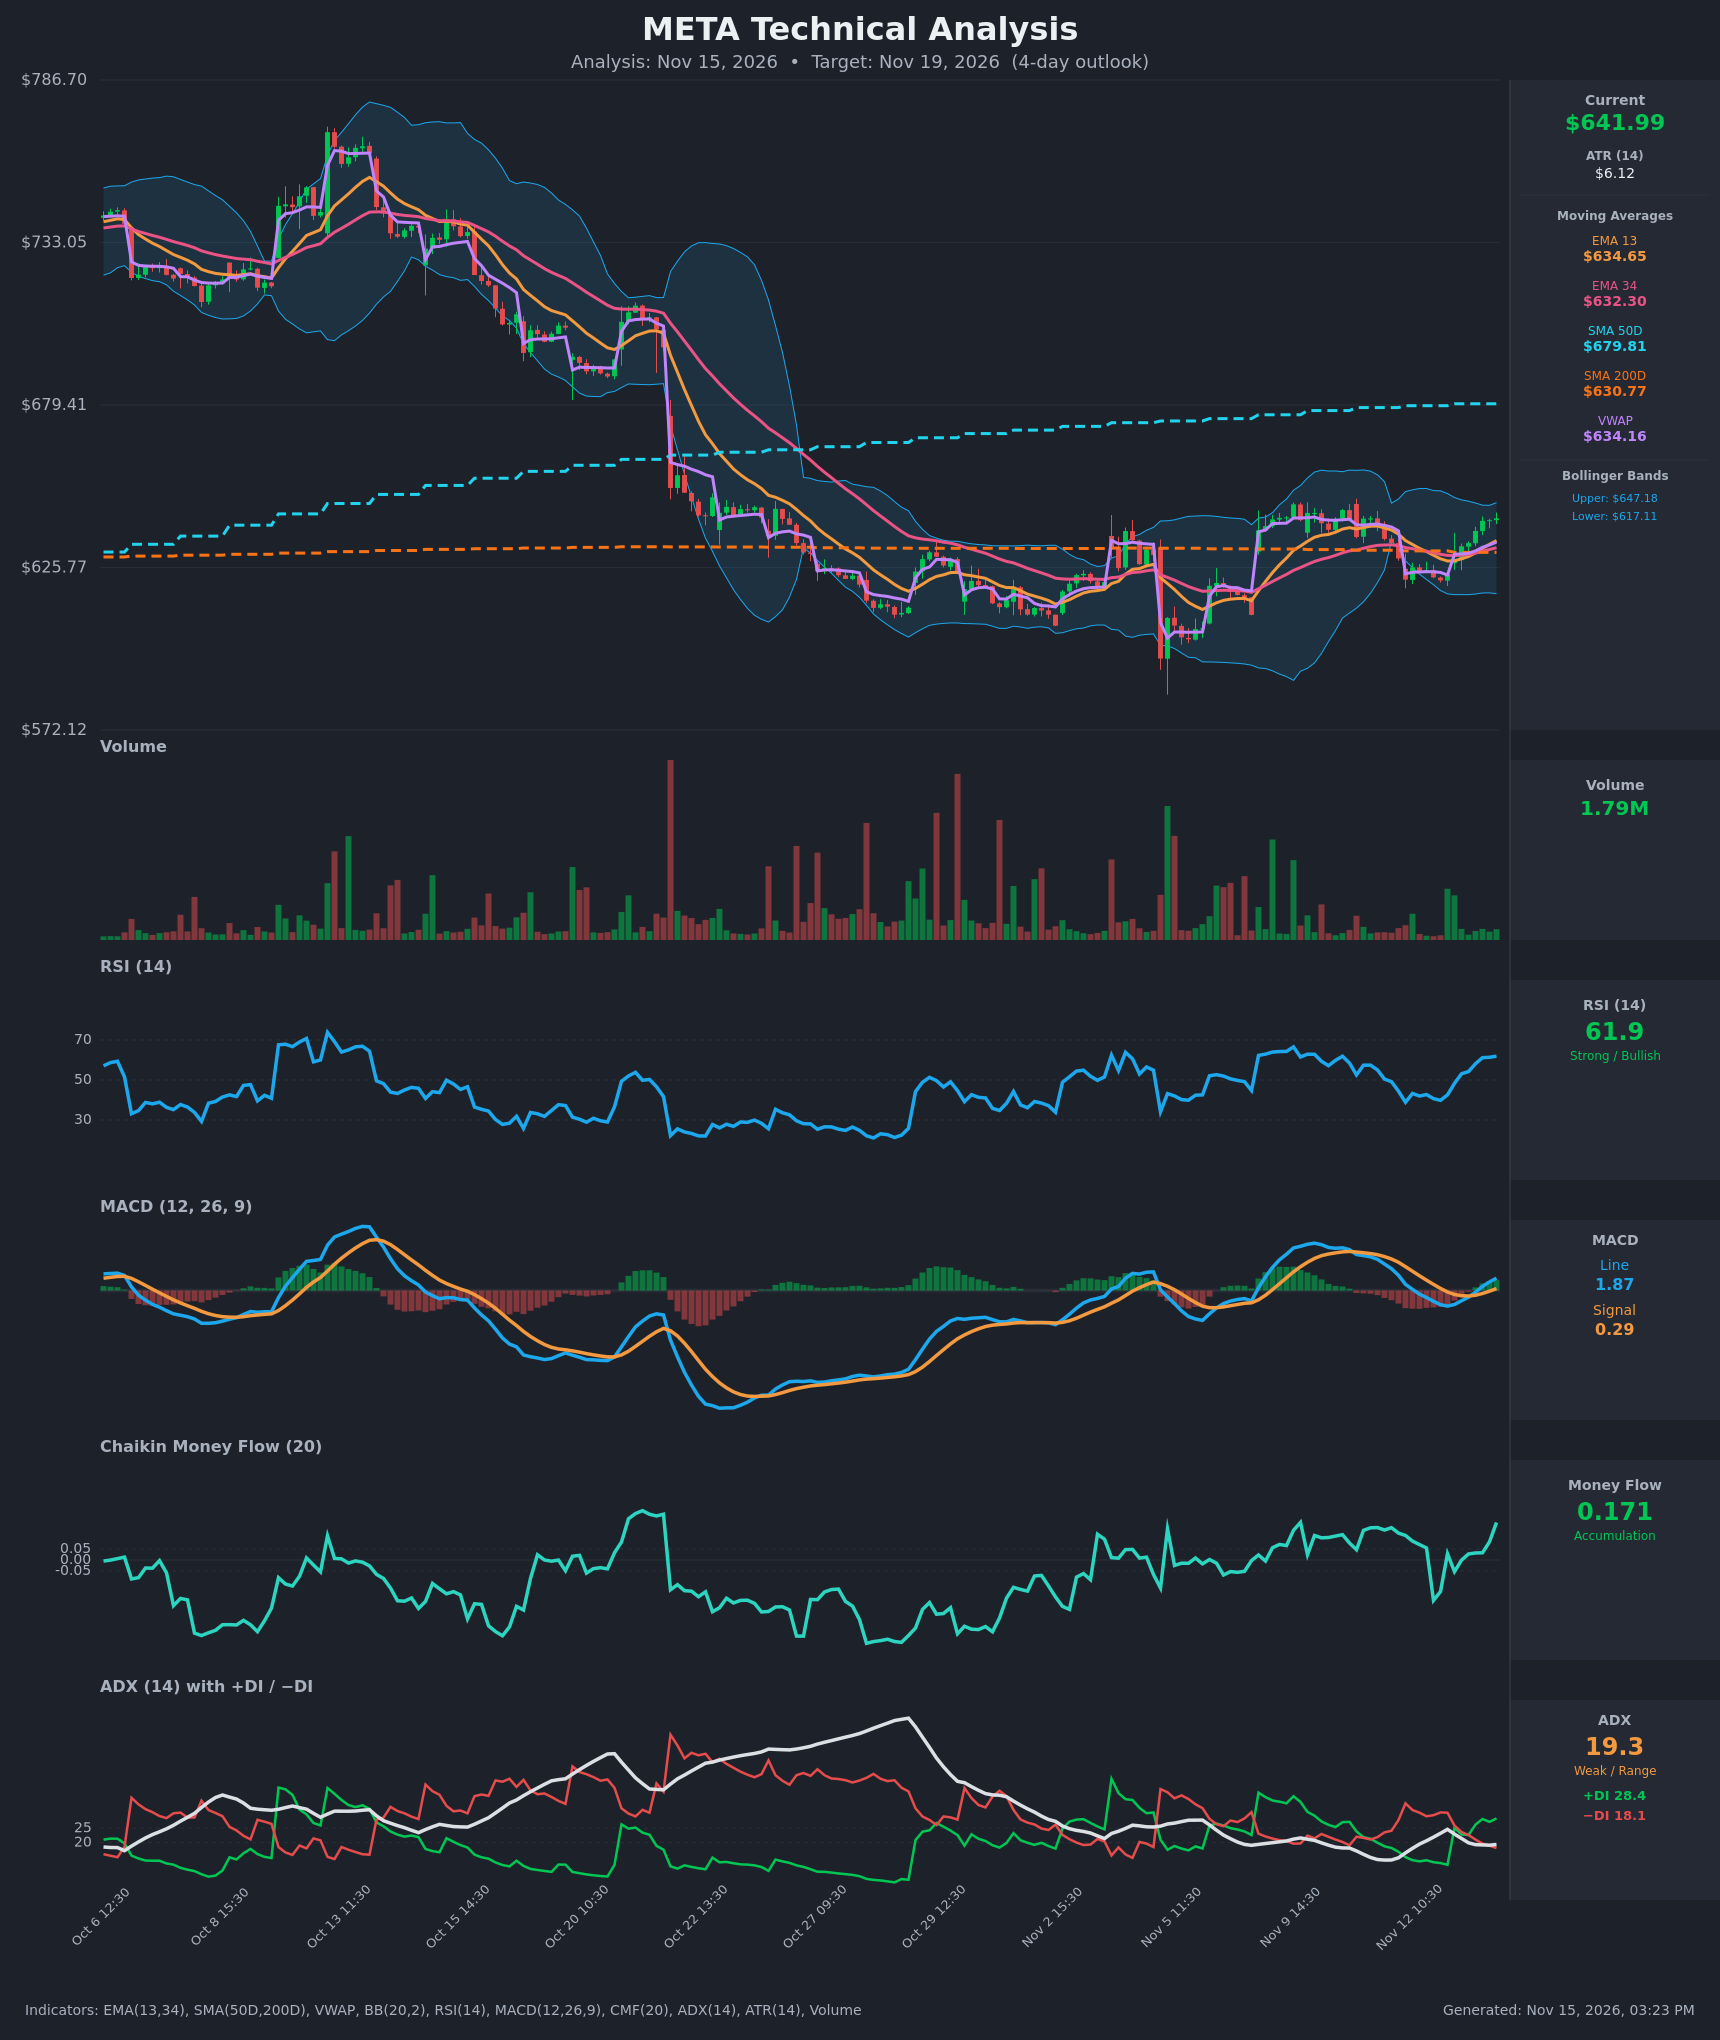
- RSI (14): 61.92, up from 38.9 on Nov 12 and rising steadily for the last 8 bars. Momentum is firmly positive and still below the 70 overbought line. [Bullish]
- 20 EMA: Not given directly. The EMA 13 is $634.65 and the EMA 34 is $632.30, and price at $641.99 sits above both. The EMA 13 has crossed back above the EMA 34 (around Nov 13 13:30), so short-term trend support sits near $634–635. [Bullish]
- MACD: The line (1.87) crossed above the signal (0.29) on Nov 13 at about 13:30–14:30. The histogram is positive (+1.58) and widening, but both lines are close to zero, so this is an early-stage recovery. [Bullish]
- Bollinger Bands (20): Upper $647.18, lower $617.11, midline about $632. Price is in the upper third of the bands, about $5 below the upper band. The bands are narrow relative to the earlier expansion, so the trend is only moderate. There is room to test the upper band, which may cap the move. [Bullish]
- CMF (20): 0.171, up from -0.05 to 0.03 over the last few bars and well above +0.05. Buying pressure is building. [Accumulation]
- ADX (14): 19.3 with +DI 28.4 over −DI 18.1. +DI crossed above −DI on Nov 13 morning, so bulls control direction. ADX is below 20, so the trend is not yet established. [Weak Trend + Bullish direction]
- Volume: 1.79M on the latest bar, in line with recent hourly bars and well below the spike volumes of late Oct and early Nov. The green bars on the advance show mild participation, but there is no strong breakout volume. [Neutral-to-mildly Bullish]
DIVERGENCES & TRENDS
- There is no clear divergence. RSI, MACD and CMF are all making higher highs alongside the price recovery, so they confirm the move.
- Price is above VWAP ($634.16), the EMA 13, the EMA 34 and the SMA 200D ($630.77). The 200D SMA has acted as a pivot and price has reclaimed it.
- The SMA 50D ($679.81) is far above price and still falling. It remains a longer-term bearish factor and a major overhead target. The 50D is above the 200D, so there is no death cross yet, although the gap is narrowing.
- The MACD bullish crossover, the +DI/−DI crossover and the EMA 13/34 bullish crossover all came within a few bars of each other, which gives a cluster of short-term bullish signals.
- ADX is falling toward 19, so the broader environment is range-bound, with a short-term bullish bias inside it.
CHART PATTERNS
- The bigger picture shows a sharp drop from about $760 to $600, followed by a base. Price has been forming higher lows since the Nov 5 low near $590 and recovering within a range of about $605–$645. This resembles a Bullish Double Bottom / rounded recovery, though not a textbook version.
- The recent consolidation under the $647 Bollinger upper band and the recent range high around $645 acts as resistance. A break above it would suggest a continuation higher.
- A clean breakout needs a push through about $647–650, with the next resistance zone at $660 and then the SMA 50D near $680.
- The pattern is only moderately reliable, because ADX is below 20 and volume is not confirming strongly.
POTENTIAL SCENARIOS
- Scenario 1: Bullish Breakout Continuation — price holds above the EMA 13/VWAP area, pushes through the upper Bollinger Band, and extends the recovery with MACD and CMF supportive. Trigger: close above $647–648 on rising volume. Target: $655–660. Invalidation: close below $634 (EMA 13/VWAP). (50% probability)
- Scenario 2: Neutral Range Consolidation — price stalls near the upper band, with RSI cooling from 62, and drifts sideways between $634 and $648. Trigger: failure to clear $647 with fading volume. Target: $638–646. Invalidation: break above $650 or below $630. (30% probability)
- Scenario 3: Bearish Pullback — the rally fades at the upper band and falls back toward the SMA 200D as ADX stays weak. Trigger: close below $634 and a MACD histogram turn lower. Target: $622–630. Invalidation: reclaim of $645. (20% probability)
PRICE TARGETS
For a 4-day timeframe the range width should be about 3–6% of price. The expected range below is $624.50 to $658.00, a width of $33.50, or about 5.2%.
- Target Price: $648.50
- Expected Range: $630.00 to $660.00 (width $30.00, about 4.7%)
- Key Levels: Support at $634.16, Resistance at $647.18
OVERALL BIAS
OVERALL BIAS: BULLISH - RSI, MACD, CMF and the +DI/−DI crossover are all rising, and price is above the EMAs, VWAP and the 200D SMA. The upside is likely limited by the upper Bollinger Band near $647 and weak ADX, so the expected gain is modest.
This is educational analysis and not financial advice.