META 6-day bullish forecast — Nov 15, 2026
- Bias: Bullish
- Timeframe: 6 days (made Nov 15, 2026, target date Nov 20, 2026)
- Price at analysis: $641.99
- Price target: $648.50
- Expected range: $628.00 – $656.00
- Result: Pending — graded after the close on Nov 20, 2026
Get a free AI analysis of META today
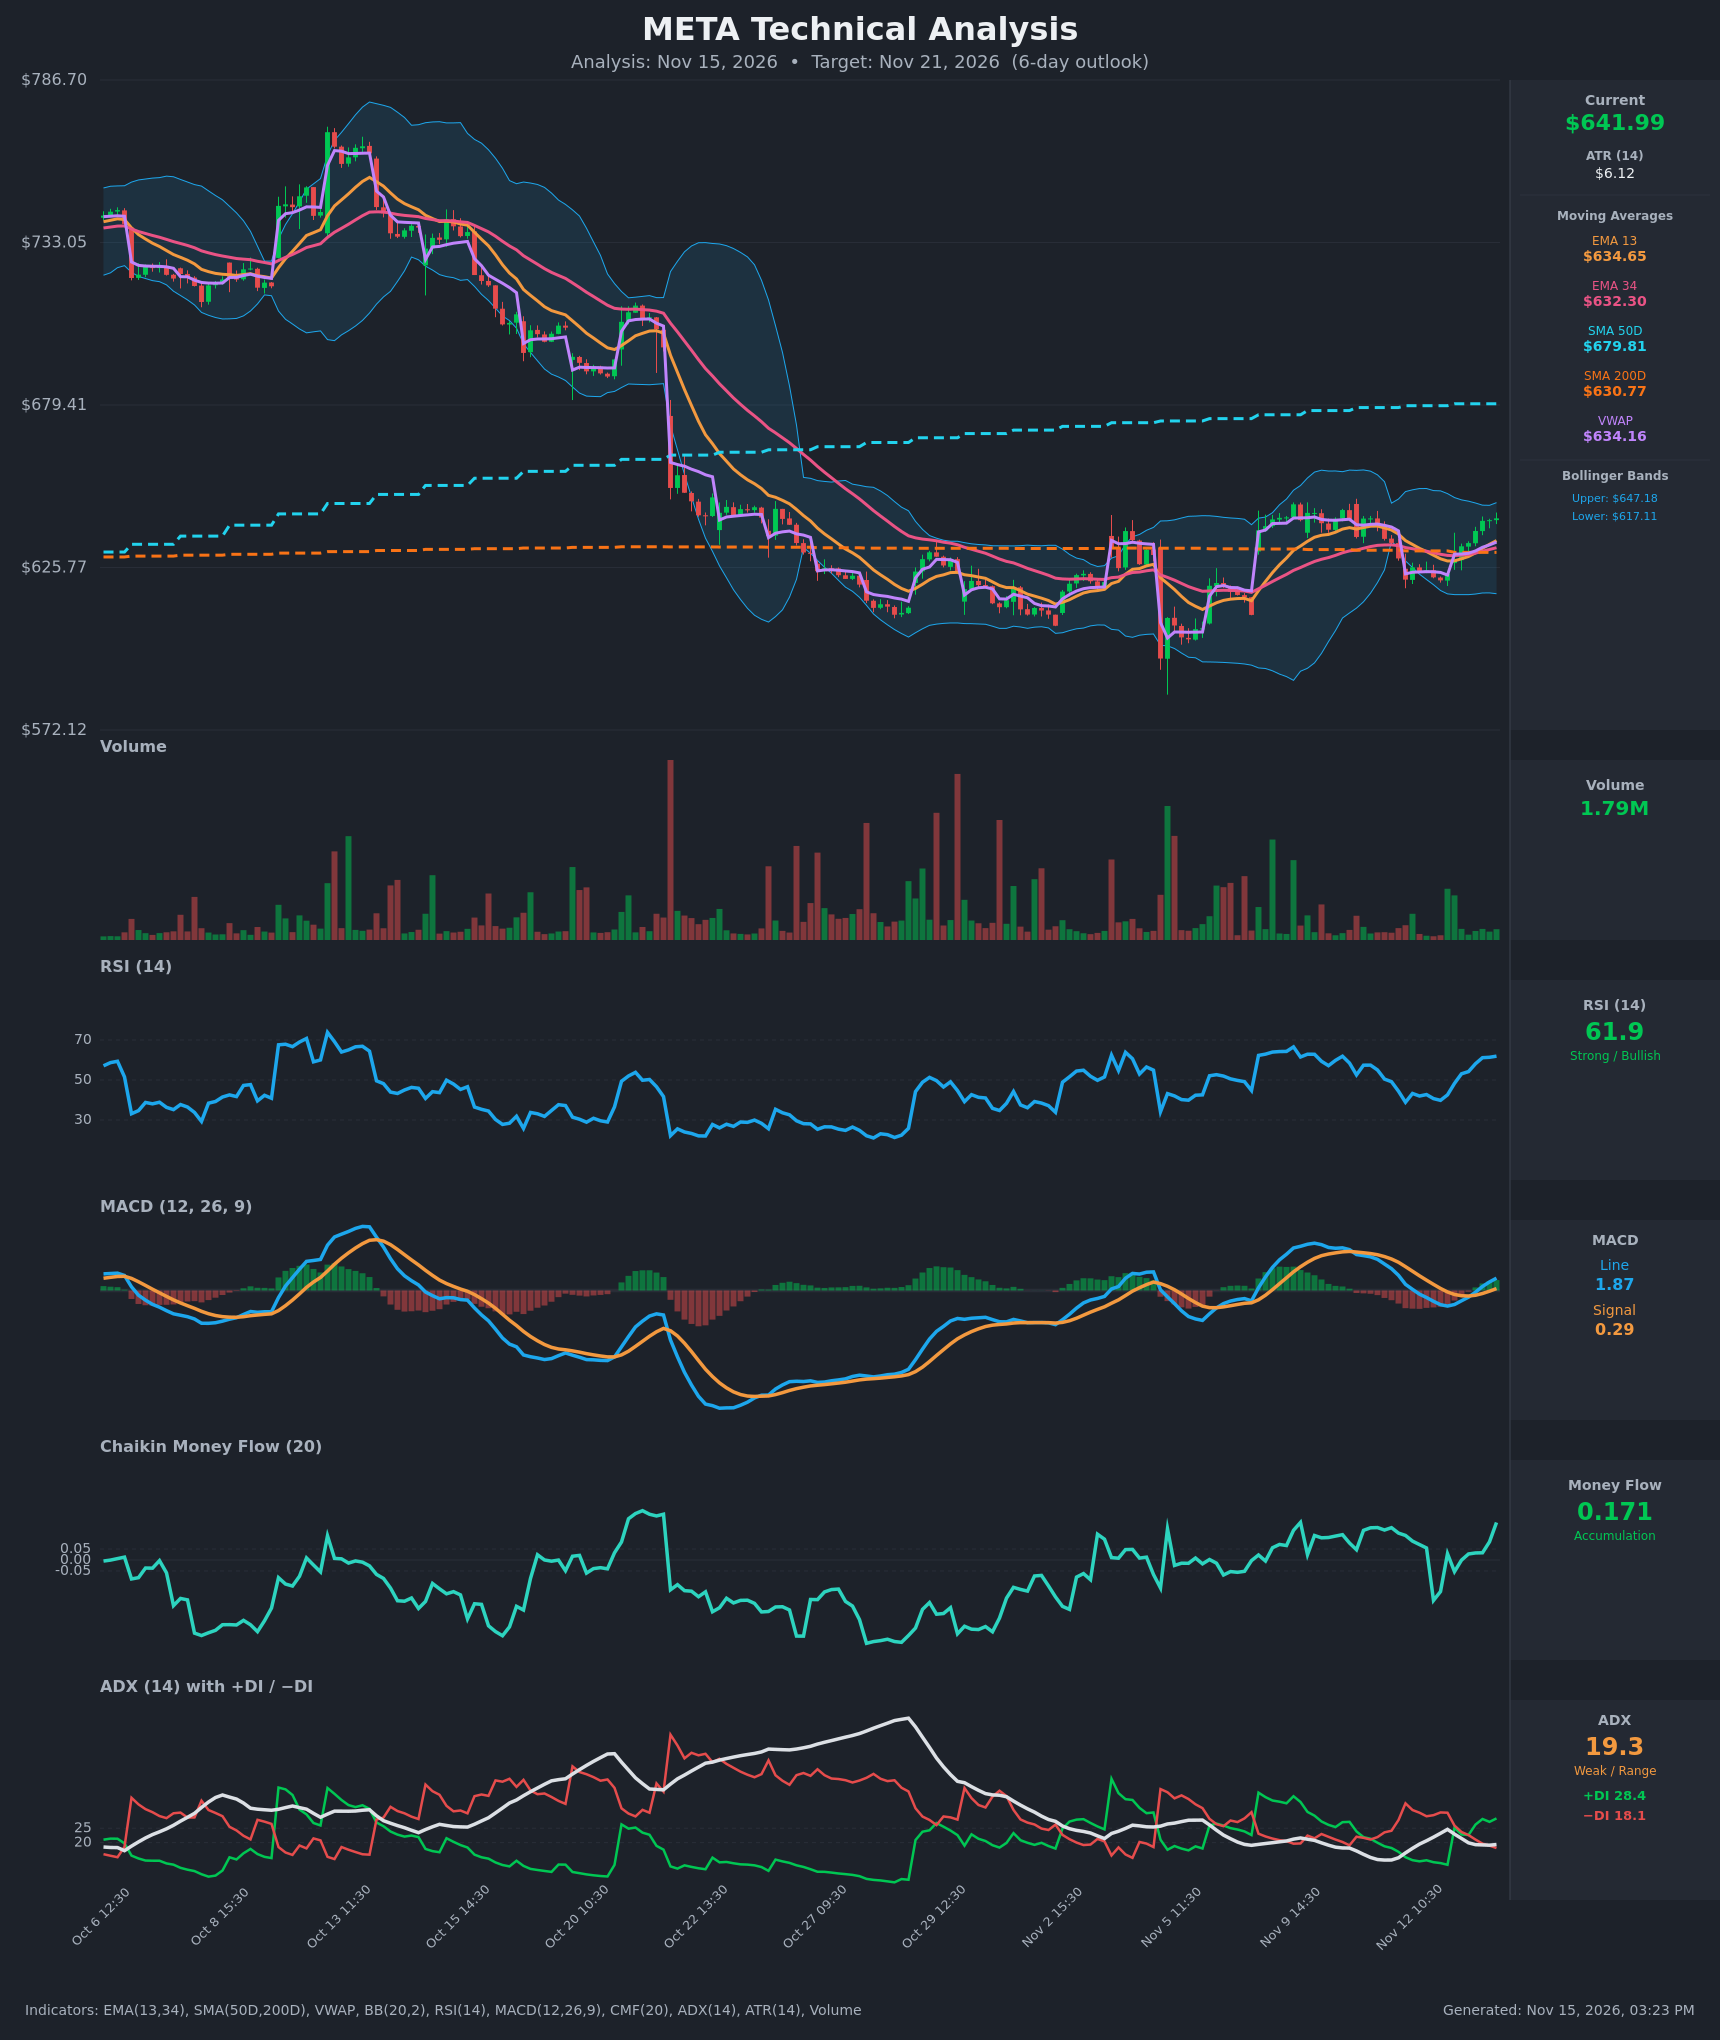
Analysis
TECHNICAL INDICATORS
- RSI (14): 61.92, up from 38.9 on Nov 12 to the low 60s. Momentum is rising and nearing but not at overbought (70). [Bullish]
- 20 EMA: Not supplied; the closest values are EMA 13 at $634.65 and EMA 34 at $632.30. Price at $641.99 is above both, and EMA 13 is above EMA 34, so the short-term stack is bullish and the EMAs act as support in the $632–$635 zone. [Bullish]
- MACD: Line 1.87 is above the signal at 0.29, a fresh bullish crossover on Nov 13 (around 13:30). The histogram has turned positive and is expanding, though the line is still near zero. [Bullish]
- Bollinger Bands (20): Upper $647.18, lower $617.11, with price at $641.99 in the upper third of the band (~83% of the range). The bands are fairly narrow after the recent consolidation, and price is approaching the upper band, which is near-term resistance. [Neutral]
- CMF (20): 0.171, rising from -0.18 on Nov 12 and well above +0.05, which signals accumulation. [Accumulation]
- ADX (14): 19.3, below 20, so trend strength is weak. +DI (28.4) is above −DI (18.1) after a bullish DI crossover on Nov 13, but without ADX above 25 the trend is not yet established. [Weak Trend + Bullish direction]
- Volume: 1.79M on the latest bar, modest and below the larger spikes seen in October and early November. The rally from $622 to $642 has come on moderate volume, so the move lacks strong confirmation. [Neutral/Mildly Supportive]
DIVERGENCES & TRENDS
- No clear divergence between price and RSI, MACD or CMF. All three rose with price over the last two sessions.
- Over the last 15 bars, RSI rose from 38.9 to 61.9, CMF turned from negative to +0.171, and MACD crossed bullish. This is a short-term momentum reversal from the Nov 12 low near $621.
- EMA 13 recrossed above EMA 34 (Nov 13), and price is above VWAP ($634.16), which indicates buying pressure.
- SMA 200D ($630.77) is being reclaimed as support. Price remains far below SMA 50D ($679.81), and SMA 50D is above SMA 200D, so there is no death cross. The larger structure is a downtrend that has stabilized into a base.
- ADX has fallen from a peak above 40 to the high teens, so the prior downtrend is exhausted and a range or new trend is forming.
CHART PATTERNS
- Since the early-November low near $590, price has built a Bullish Double Bottom / base with a higher low around $621–$622 on Nov 12. Confirmation would be a break above the recent swing high near $647–$650, which is also the upper Bollinger Band.
- The range between roughly $620 and $648 looks like a Bullish Flag/consolidation following the Nov 5 bounce. A break above $648 would project toward $660–$665 (about the height of the range).
- Overhead, the downward-sloping SMA 50D near $680 is the major resistance for any larger recovery.
POTENTIAL SCENARIOS
- Scenario 1: Bullish Breakout Continuation — Momentum (MACD cross, CMF accumulation, +DI over −DI) pushes price through the upper Bollinger Band and the $648 resistance. Trigger: close above $648 on rising volume. Target: $655–$662. Invalidation: close back below $632 (EMA 34 / SMA 200D). (50% probability)
- Scenario 2: Neutral Consolidation Near Resistance — Price stalls near the upper band with weak ADX and chops between $632 and $648. Trigger: failure to hold above $647 with a drift lower. Target: $635–$645. Invalidation: a decisive break above $650 or below $628. (28% probability)
- Scenario 3: Bearish Rejection — Price is rejected at the upper band and fades back below the EMAs and SMA 200D, resuming the larger downtrend. Trigger: close below $630. Target: $617–$622. Invalidation: close above $650. (22% probability)
PRICE TARGETS
For a 6-day horizon, the guide calls for a width of about 4–8% of price. ATR of $6.12 implies roughly ±$15 over 6 days. Range check: $628.00 to $656.00 is $28 wide, or 4.4% of $641.99, which fits the 7–10 day lower bound and suits a 6-day window.
- Target Price: $648.50 (for the 6-day timeframe)
- Expected Range: $628.00 to $656.00
- Key Levels: Support at $634.65 (EMA 13; SMA 200D at $630.77 below it), Resistance at $647.18 (upper Bollinger Band; SMA 50D at $679.81 is the larger ceiling)
OVERALL BIAS
OVERALL BIAS: BULLISH - A fresh MACD bullish crossover, rising RSI, CMF accumulation at 0.171, and price above the EMAs, VWAP and SMA 200D support a modest upside move toward the $648–$655 area. The weak ADX (19.3) and nearby upper Bollinger Band resistance limit conviction.
This is educational analysis and not financial advice.