USO 4-day bullish forecast — Nov 15, 2026
- Bias: Bullish
- Timeframe: 4 days (made Nov 15, 2026, target date Nov 18, 2026)
- Price at analysis: $145.59
- Price target: $147.00
- Expected range: $142.60 – $148.80
- Result: Pending — graded after the close on Nov 18, 2026
Get a free AI analysis of USO today
Analysis
TECHNICAL INDICATORS
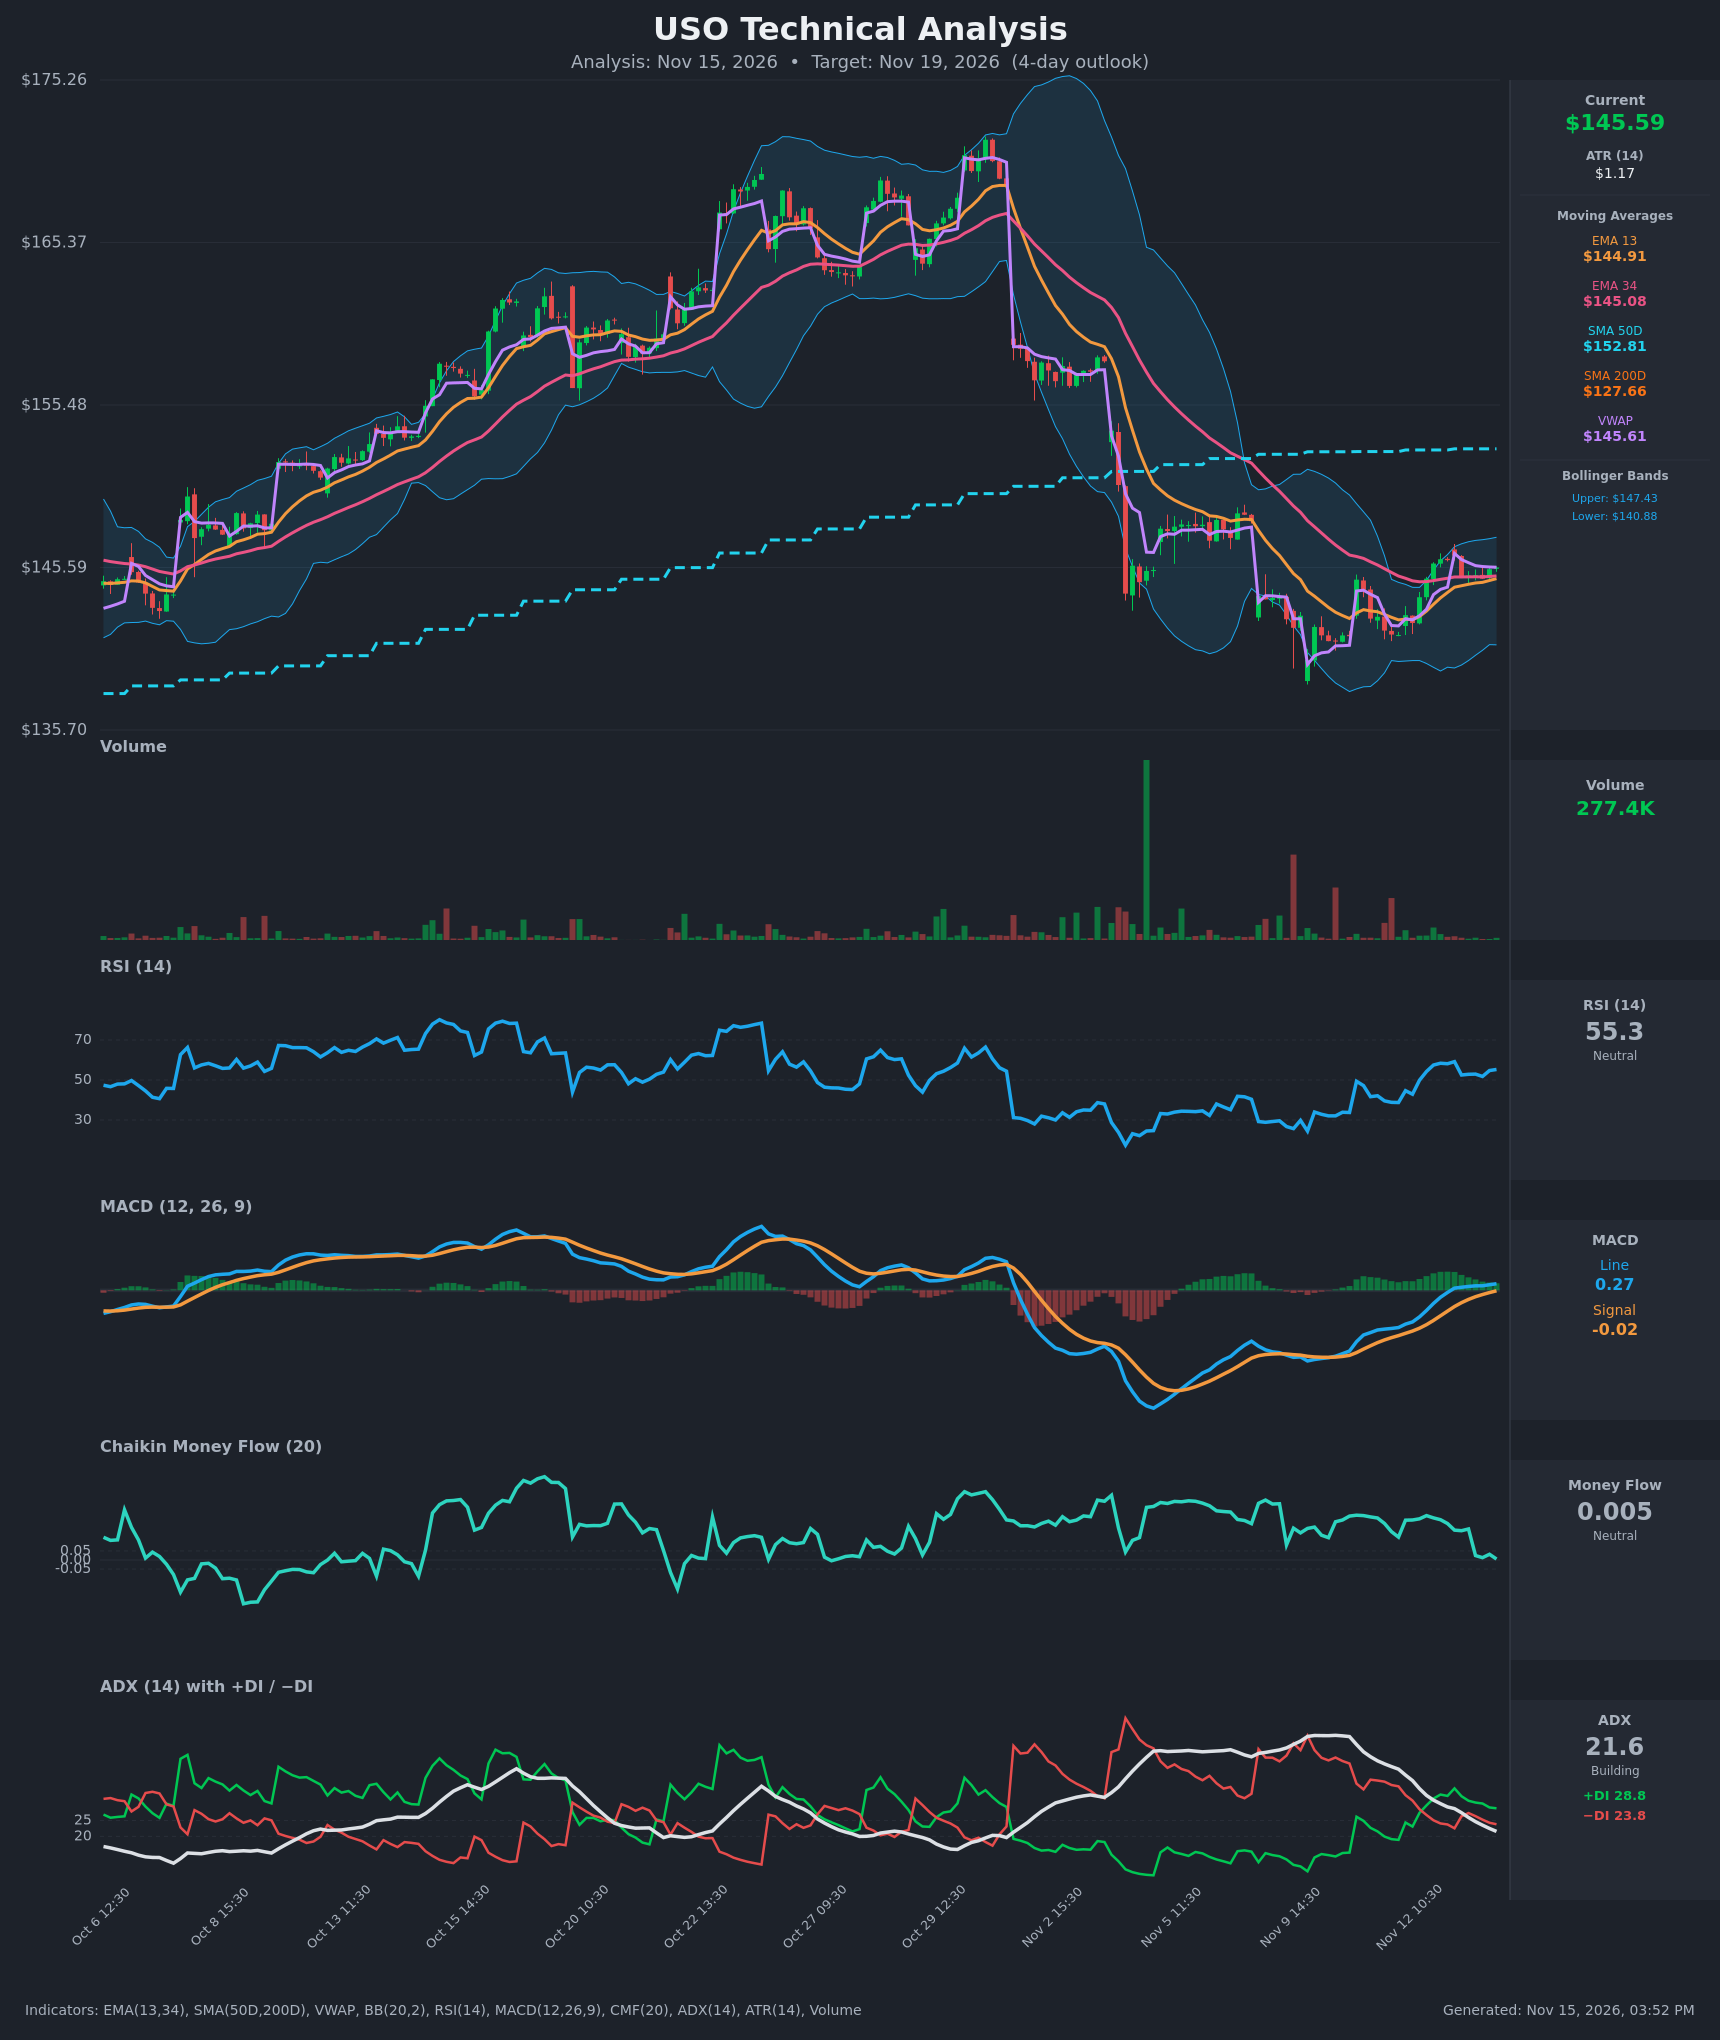
- RSI (14): 55.27, just above the 50 midline and recovering from the 38.7 low on Nov 11. Momentum is improving but flat over the last few bars, with no overbought or oversold condition. [Bullish]
- 20 EMA (EMA 13 / EMA 34 used): Price at $145.59 is above EMA13 ($144.91) and EMA34 ($145.08), so both now act as nearby support. EMA13 has not yet crossed above EMA34 (a gap of about $0.17), but the gap has narrowed steadily from about $2.60 on Nov 11. [Bullish]
- MACD: The line (0.275) crossed above the signal (-0.019) on Nov 13, and the histogram is positive and widening. Both lines are only just above zero, so the recovery is early. [Bullish]
- Bollinger Bands (20): Upper $147.43, lower $140.88, so the bands are fairly wide (about $6.5). Price sits in the upper-middle of the band after bouncing from the lower band. The bands are contracting after the volatile selloff, which points to a coming range or modest expansion. [Neutral]
- CMF (20): 0.005, inside the ±0.05 neutral zone, and it has faded from about 0.22 on Nov 12. Buying pressure has dissipated, so the bounce lacks volume confirmation. [Neutral]
- ADX (14): 21.6 and falling from 41, which means the prior downtrend has exhausted and the market is moving toward range-bound. +DI (28.8) is above −DI (23.8), so bulls have a slight edge, but the trend is weak. [Weak Trend, Mild Bullish]
- Volume: 277.4K, light and well below the spike volumes seen during the early-November selloff. The bounce is happening on subdued participation, so there is no strong conviction in either direction. [Neutral]
DIVERGENCES & TRENDS
- Momentum recovery: RSI made a higher low (about 38.7 versus the earlier ~30 trough), and MACD has turned up from deeply negative territory. This is a base-building sign.
- CMF fading: CMF has dropped from 0.22 to ~0 while price held, a mild warning that buying interest is thinning on this bounce.
- Crossovers: The MACD bullish crossover is confirmed. +DI crossed back above −DI on Nov 12. EMA13 and EMA34 are about to cross but have not yet.
- Long-term trend: Price is below the SMA50D ($152.81, still rising) and above the SMA200D ($127.66), so the long-term uptrend is intact but the intermediate trend is corrective. Price is sitting right at VWAP ($145.61), a fair-value pivot.
CHART PATTERNS
- Bullish Double Bottom (loose): Lows near $139 (Nov 9-10) and about $141 (Nov 11) with a recovery above $145 resemble a double bottom. The neckline sits near $146.3-$147, and a break of it projects toward $150+, though that measured move is beyond a 4-day horizon.
- Possible Bullish Falling Wedge / base: The decline from $170 into the $139 low, followed by tighter ranges and higher lows, supports a basing structure. It needs a close above $147.4 (the BB upper) to confirm.
- Overhead resistance: The SMA50D near $152.8 is the main cap on any larger rebound.
POTENTIAL SCENARIOS
- Scenario 1: Bullish Base Breakout Attempt — The MACD crossover, +DI lead and higher lows push price through the recent high near $146.3 toward the BB upper band. Trigger: hourly close above $146.40 with rising volume. Target: $147.40-$148.80. Invalidation: close below $144.40, which is under both EMAs. (50% probability)
- Scenario 2: Neutral Range Chop — Weak ADX and neutral CMF keep price oscillating around VWAP and the EMAs. Trigger: failure to break $146.4 while holding $144.4. Target: $144.50-$146.50. Invalidation: a break outside $144.0-$147.5. (28% probability)
- Scenario 3: Bearish Failed Bounce — Thin volume and fading CMF let the bounce roll over, and sellers push price below the EMA cluster. Trigger: close below $144.40 with MACD histogram turning negative. Target: $142.00-$141.00 (near the Nov 11 low and lower band). Invalidation: reclaim of $146.00. (22% probability)
PRICE TARGETS
- Target Price: $147.00 (4-day horizon)
- Expected Range: $142.60 to $148.80 (width $6.20, about 4.3% of the current price, appropriate for a 4-day window)
- Key Levels: Support at $144.90 (EMA13), Resistance at $147.43 (upper Bollinger Band)
OVERALL BIAS
OVERALL BIAS: BULLISH - The MACD bullish crossover, +DI above −DI, RSI recovering above 50 and price above both EMAs, together with a loose double-bottom base, favor a modest further rebound toward the $147 area. Conviction is modest because ADX is weak, CMF is neutral and volume is light.
This is educational analysis and not financial advice.