ASTS 13-day bearish forecast — Nov 15, 2026
- Bias: Bearish
- Timeframe: 13 days (made Nov 15, 2026, target date Nov 27, 2026)
- Price at analysis: $32.60
- Price target: $31.00
- Expected range: $28.20 – $35.60
- Result: Pending — graded after the close on Nov 27, 2026
Get a free AI analysis of ASTS today
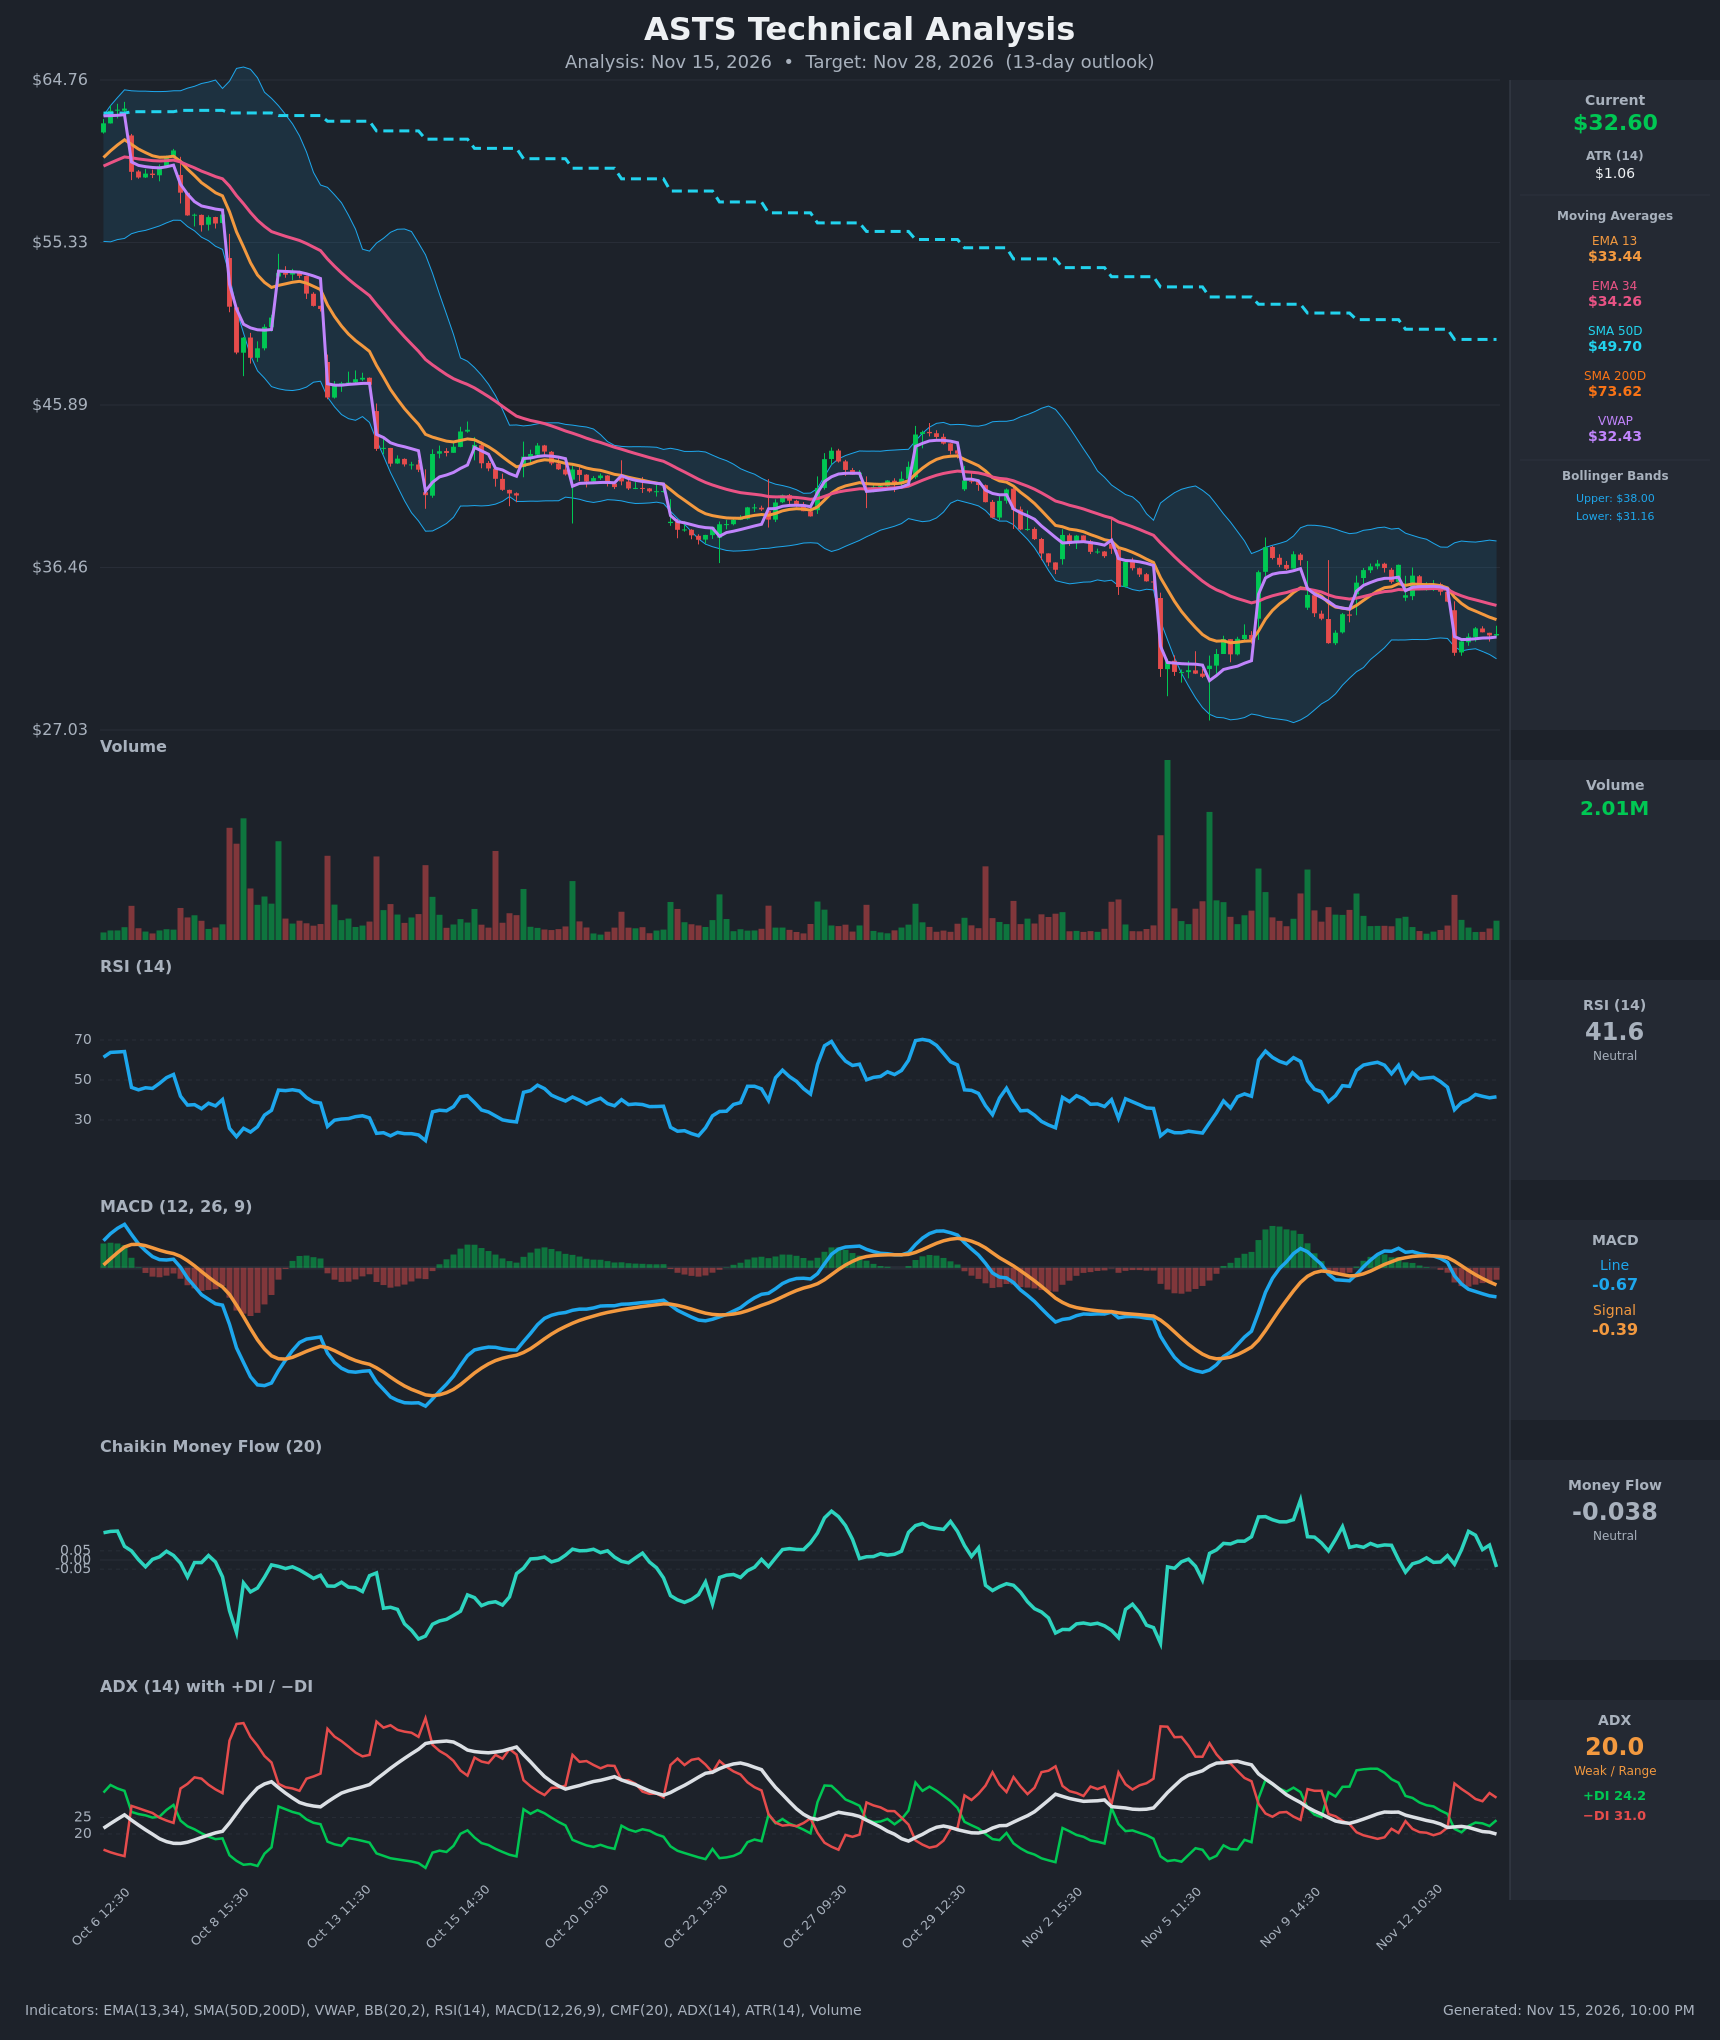
Analysis
TECHNICAL INDICATORS
- RSI (14): 41.59, below the 50 midline and falling from about 51 on Nov 12. It bounced off 35 on Nov 13 but remains in the lower half of its range, with no oversold reading (<30) to support a reversal. [Bearish]
- 20 EMA (EMA 13 / EMA 34 used): Price at $32.60 is below EMA 13 ($33.44) and EMA 34 ($34.26). EMA 13 is under EMA 34 and the gap is widening, so both averages are overhead resistance. [Bearish]
- MACD: Line -0.669 is below signal -0.395 and the histogram is negative at about -0.27. It crossed bearishly on Nov 13 around 11:30 and the spread is still widening. [Bearish]
- Bollinger Bands (20): Upper $38.00, lower $31.16. Price at $32.60 sits in the lower third of the bands, about $1.44 above the lower band. The bands are fairly flat and narrow after the earlier expansion, so there is no squeeze breakout yet. A retest of the lower band is likely. [Neutral]
- CMF (20): -0.038 is inside the ±0.05 neutral zone, but it has dropped from +0.156 to slightly negative. Money flow is fading. [Neutral]
- ADX (14): 20.0 and falling, so the trend is weak. −DI (31.0) is above +DI (24.2), and the DI cross to the bearish side occurred on Nov 13 at the open. Bears control direction, but with little trend strength. [Weak Trend + Bearish]
- Volume: 2.01M, below the earlier spikes. The Nov 13 gap-down came on elevated volume, and the rebound since has been on light volume. Price is slightly above VWAP ($32.43). [Weak bounce, mildly bearish]
DIVERGENCES & TRENDS
- No clear divergence. RSI made a higher low (35 versus roughly 25–26 at the early-Nov low) while price also bottomed near $30, which is only a mild improvement and not a confirmed bullish divergence.
- The long-term structure is firmly bearish. Price is far below SMA50D ($49.70) and SMA200D ($73.62), and SMA50D is below SMA200D (death cross already in place). Both averages are still declining.
- On Nov 13, EMA 13 stayed below EMA 34, MACD crossed below its signal, and −DI crossed above +DI. These shifts confirm renewed short-term downside momentum after the gap-down from ~$34.5 to $31.5.
- ADX is drifting down toward 20, so the market is moving toward a range. The price range has been roughly $30–$38 since Nov 5, with support near $30–$31.
- Price is holding just above VWAP. That is the main short-term support, and a loss of it would open the way to the lower band and the early-Nov low.
CHART PATTERNS
- The broader structure is a long downtrend that has stepped down, with a lower-high sequence from $64 to $45 to $38.
- Since Nov 5, price has formed a loose sideways consolidation between about $30 and $38. After the Nov 13 gap-down, it is trading near the bottom of that range, which resembles a Bearish Rectangle / Bearish Flag-type continuation, though not a textbook example.
- A support break would be the trigger. A sustained break under $30–$31 targets roughly $27 (the chart low) and the measured move of the range, around $24–$26. The $30–$31 area has also acted as a double bottom attempt (Bullish Double Bottom reference), but it needs a rally above $35–$36 (the EMA 13/34 zone) to confirm.
POTENTIAL SCENARIOS
- Scenario 1: Bearish Retest and Break of Range Support — Price stays capped under the falling EMA 13/34 while MACD and −DI keep bearish control, and it drifts down to test the lower Bollinger Band and the Nov 5 low. Trigger: loss of VWAP (~$32.40) and close below $31.16. Target: $29.50–$30.00, with extension to $27.50. Invalidation: daily close above $34.30 (EMA 34). (55% probability)
- Scenario 2: Neutral Range Chop — Weak ADX keeps price inside $31–$35 as the stock bases near support. Trigger: holds $31.16 with RSI stabilizing above 40. Target: $32–$34. Invalidation: close outside $30.80–$35.00. (20% probability)
- Scenario 3: Bullish Double-Bottom Bounce — Defense of the $30–$31 zone triggers a relief rally back to the EMA cluster and the upper-mid band. Trigger: reclaim of EMA 13 ($33.44) on rising volume. Target: $35.50–$36.50. Invalidation: close under $30.50. (25% probability)
PRICE TARGETS
- Target Price: $31.00 (13-day)
- Expected Range: $28.20 to $35.60 (width $7.40 ≈ 22.7%; this is wider than the ~8–12% guideline for 14–21 days, justified by the stock's high volatility, with ATR of about 3.3% of price per bar and a gap-prone chart. Core range most likely $29.00–$34.50.)
- Key Levels: Support at $31.16 (lower Bollinger Band; below that $30.00), Resistance at $33.44 (EMA 13; above that $34.26 EMA 34)
OVERALL BIAS
OVERALL BIAS: BEARISH - Price is below EMA 13/34 and both long-term SMAs, MACD and the DIs have turned bearish, and RSI is below 50 with fading CMF. The most likely path is a retest of the $30–$31 support zone, with the weak ADX limiting the size of the decline.
This is educational analysis and not financial advice.