META 13-day bullish forecast — Nov 15, 2026
- Bias: Bullish
- Timeframe: 13 days (made Nov 15, 2026, target date Nov 27, 2026)
- Price at analysis: $641.99
- Price target: $653.00
- Expected range: $614.00 – $678.00
- Result: Pending — graded after the close on Nov 27, 2026
Get a free AI analysis of META today
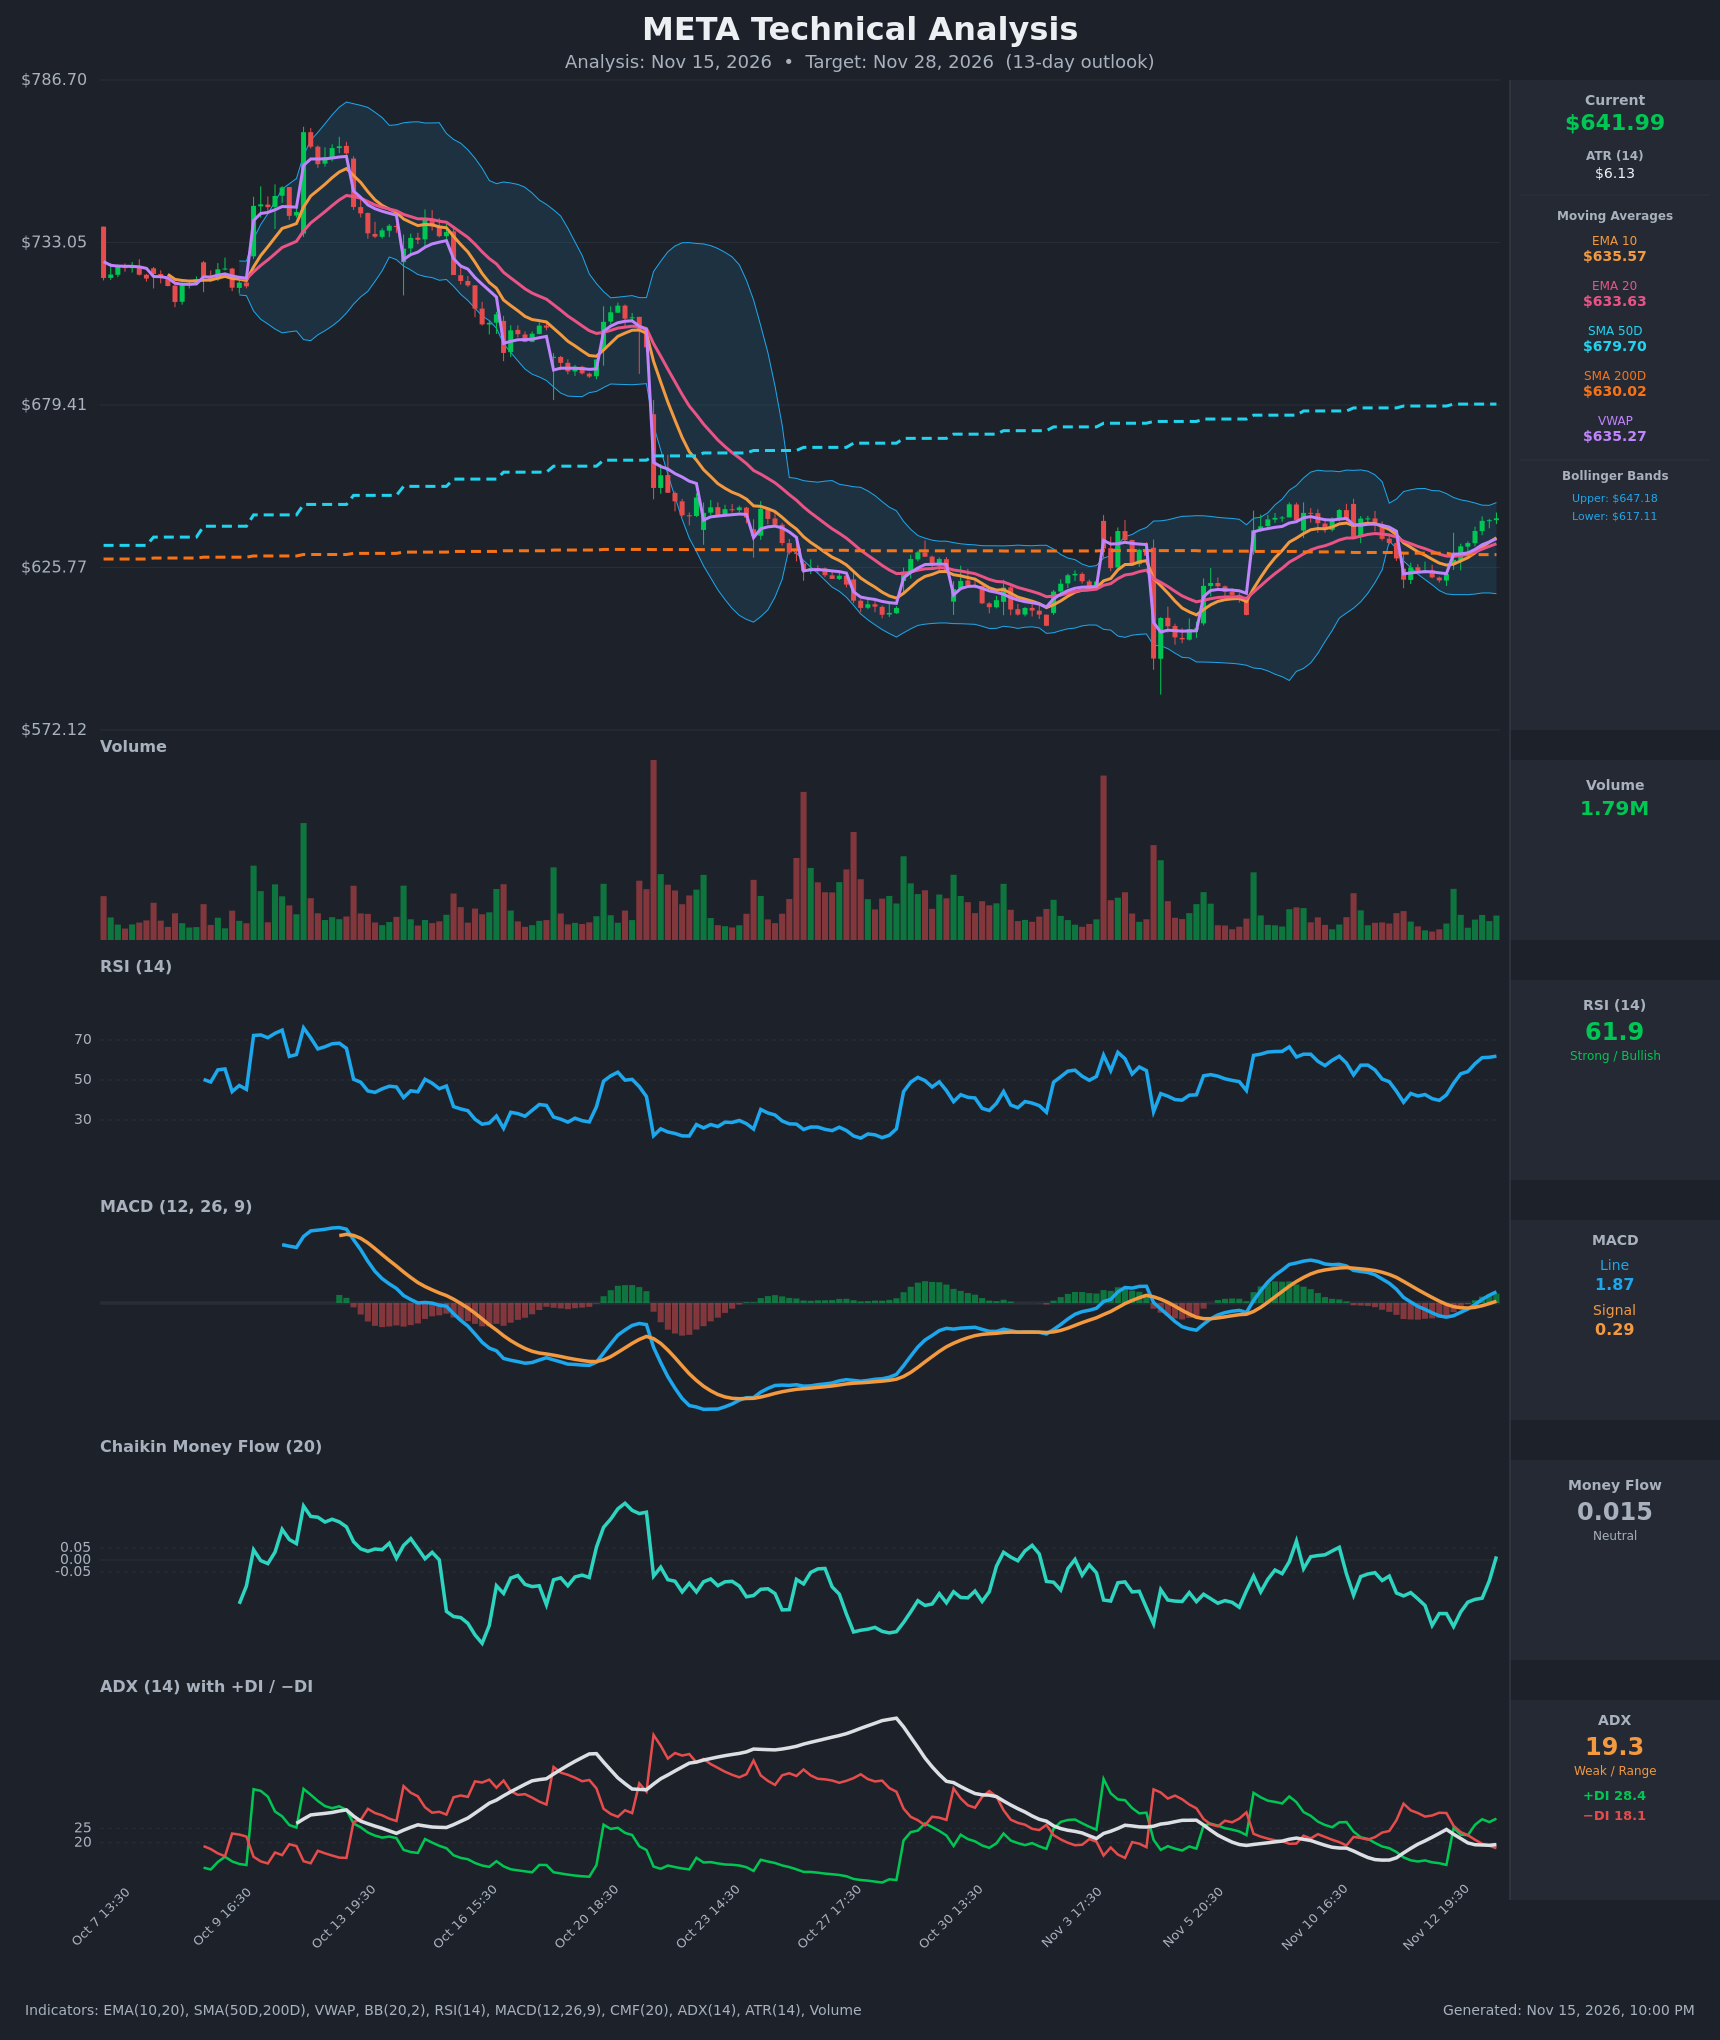
Analysis
TECHNICAL INDICATORS
- RSI (14): 61.9, up sharply from 39.8 on Nov 12. Momentum is strong but not yet overbought (70 is the threshold), so there is some room to run. [Bullish]
- 20 EMA: $633.63. Price at $641.99 is about 1.3% above it, and EMA10 ($635.57) has crossed above EMA20. The EMA20 is now acting as support. [Bullish]
- MACD: Line 1.87 is above Signal 0.29. The bullish crossover occurred around Nov 13 18:30, and the histogram has flipped positive and is expanding (about +1.58). [Bullish]
- Bollinger Bands (20): Upper $647.18, lower $617.11, so price sits in the upper third of the bands, about $5 below the upper band. The bands are fairly narrow after a contraction, and a push to the upper band is likely. The ceiling is close, so short-term upside is somewhat limited. [Neutral]
- CMF (20): 0.015, a recent rise from -0.275 and a cross above zero. This is still inside the neutral band (±0.05), so accumulation is not yet confirmed. [Neutral]
- ADX (14): 19.3 with +DI 28.4 above −DI 18.1. The bullish DI crossover happened Nov 13. ADX is below 20, so the trend is weak and any directional move is still immature. [Weak Trend, Bullish direction]
- Volume: 1.79M, average to slightly below average with no standout surge. The recent rally is not backed by strong volume, which lowers conviction in the breakout. [Neutral / Mild Caution]
DIVERGENCES & TRENDS
- No clear price/indicator divergence. RSI, MACD and price have all risen together over the last two sessions.
- EMA10 crossed above EMA20 and MACD crossed bullishly, while +DI crossed above −DI. Price has also reclaimed VWAP ($635.27) and the SMA200D ($630.02), which was a key reclaim.
- The SMA50D ($679.70) is still well above price and rising, but it has been above the SMA200D for a long time. No golden or death cross is imminent, and the SMA50D acts as overhead resistance about 6% away.
- Longer-term, the downtrend from the ~$780 peak has stalled, and price has been basing around $600–$650 since late October. Recent lows are higher.
- Weak ADX and neutral CMF show the move is not yet backed by volume or trend strength.
CHART PATTERNS
- Potential Bullish Double Bottom / Triple-Bottom Base: Price has tested the $600–$620 area several times (late Oct, Nov 4–5, Nov 12) and is now bouncing. A move above the roughly $648–$650 neckline (the upper Bollinger Band and recent highs) would confirm it, with a measured target near $670–$680, which coincides with the SMA50D.
- Range-bound consolidation: Price has been in a roughly $600–$650 band for about 3 weeks, and a breakout above $650 would end it.
- No definitive continuation pattern is complete. The base is the most relevant reference-diagram structure.
POTENTIAL SCENARIOS
- Scenario 1: Bullish Breakout From Base — Bullish momentum persists, and price clears the upper Bollinger Band and the $648–$650 resistance on improving volume, moving toward the SMA50D. Trigger: close above $650 with CMF above +0.05. Target: $665–$678. Invalidation: close below $630 (EMA20/SMA200D). (50% probability)
- Scenario 2: Neutral Range Consolidation — Price stalls at the upper band and chops between $630 and $650 as ADX stays weak. Trigger: rejection near $647–$650 without a volume surge. Target: $635–$648. Invalidation: a close outside the $628–$652 range. (28% probability)
- Scenario 3: Bearish Failed Rally — The bounce fades at resistance and price loses the EMAs and SMA200D, retesting the recent lows. Trigger: close below $630 with MACD turning down. Target: $610–$618. Invalidation: close above $652. (22% probability)
PRICE TARGETS
For the 13-day timeframe (a width of roughly 8–12% is appropriate):
- Target Price: $653.00 (about +1.7%, slightly above current price, reflecting a modest bullish drift against the nearby upper band and SMA50D resistance)
- Expected Range: $614.00 to $678.00 (width $64 = about 10.0% of current price)
- Key Levels: Support at $630.02 (SMA200D / EMA20 zone), Resistance at $647.18 (upper Bollinger Band), with further resistance at $679.70 (SMA50D)
OVERALL BIAS
OVERALL BIAS: BULLISH - MACD and DI crossovers, price above the EMAs, VWAP and SMA200D, and RSI near 62 all favor upside, though weak ADX, neutral CMF and the nearby upper Bollinger Band and SMA50D limit the extent of the gain.
This is educational analysis and not financial advice.