INTC 13-day bearish forecast — Nov 15, 2026
- Bias: Bearish
- Timeframe: 13 days (made Nov 15, 2026, target date Nov 27, 2026)
- Price at analysis: $59.66
- Price target: $58.20
- Expected range: $55.30 – $61.50
- Result: Pending — graded after the close on Nov 27, 2026
Get a free AI analysis of INTC today
Analysis
TECHNICAL INDICATORS
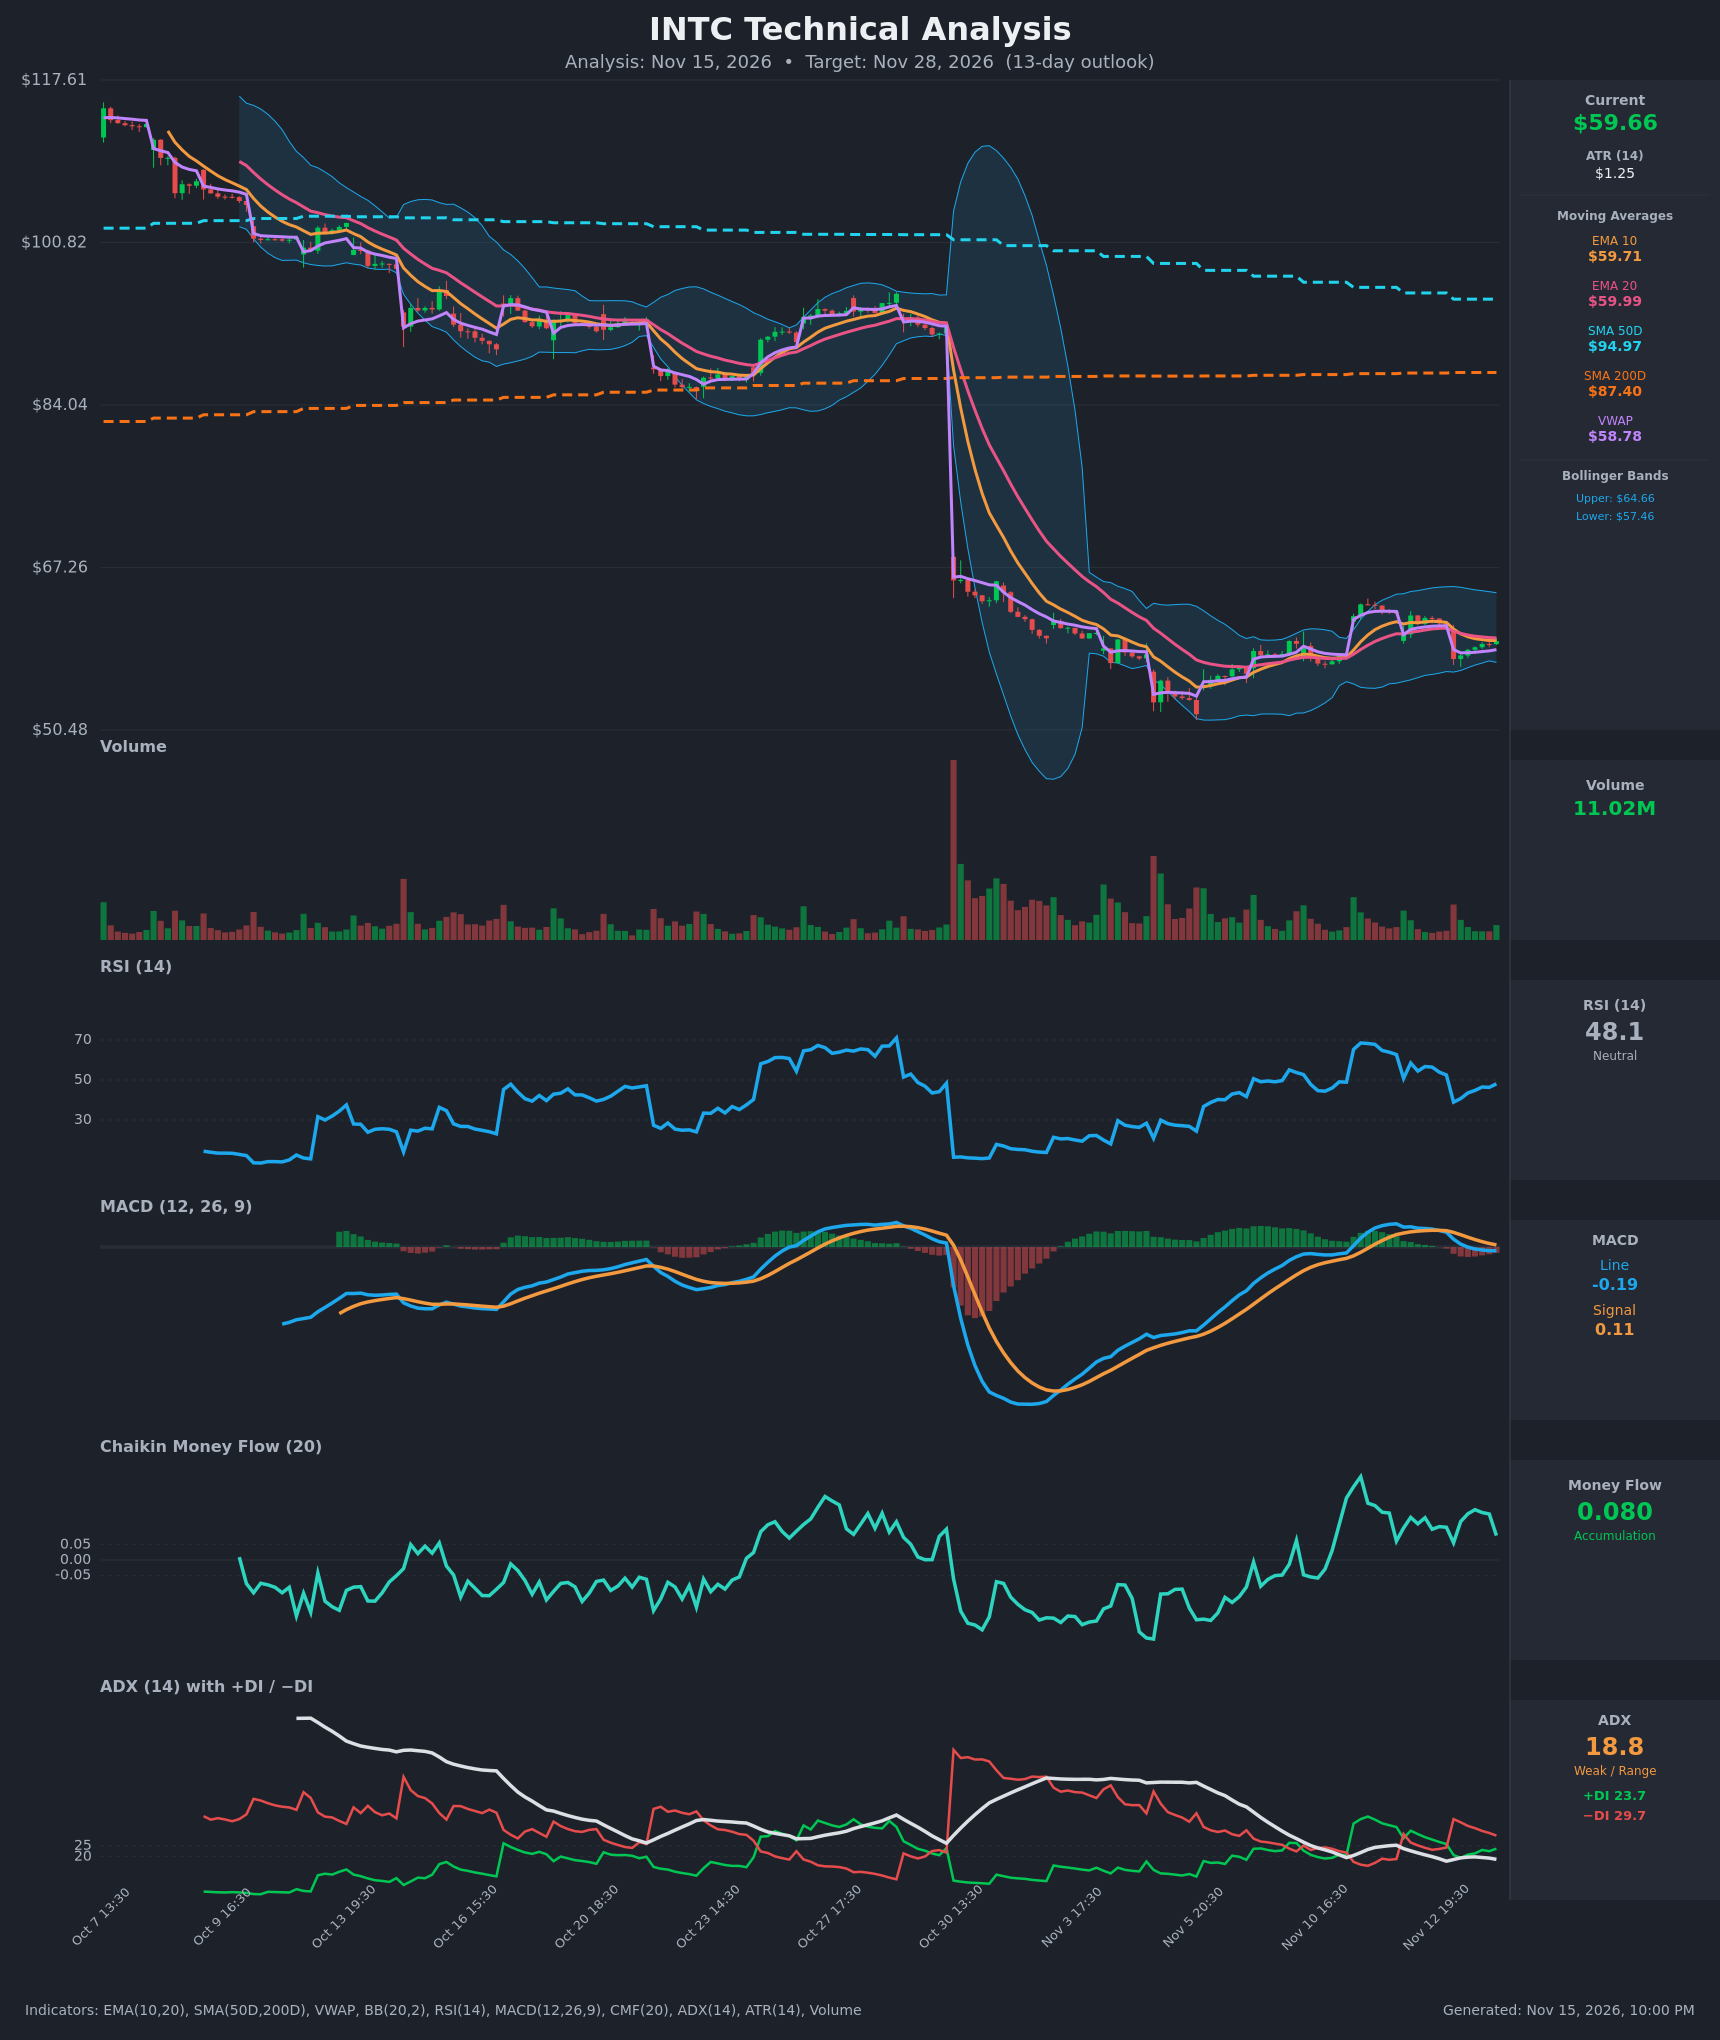
- RSI (14): 48.08, neutral. It collapsed from about 63 to 39 on Nov 13, then recovered to the high 40s. Momentum is stabilizing but has not regained 50. [Neutral]
- 20 EMA: $59.99, with price at $59.66 just below it. EMA10 ($59.71) crossed below EMA20 on Nov 13, so the short-term EMAs are now overhead resistance. Price is also far below SMA50 ($94.97) and SMA200 ($87.40), and the death cross is long established. [Bearish]
- MACD: Line -0.186 is below Signal 0.107 after a bearish cross on Nov 13. The histogram is negative and widening, so short-term momentum is fading. The line is still near zero, so the damage is modest. [Bearish]
- Bollinger Bands (20): Upper $64.66, lower $57.46, so price sits just below the midline (about $61). The bands are narrow compared with the late-October blowout, which signals volatility compression and a coiling range. [Neutral]
- CMF (20): +0.080, above the +0.05 threshold. It has stayed positive through the recent bounce, which points to mild accumulation. It has faded from a 0.164 peak. [Accumulation]
- ADX (14): 18.8, below 20, so the trend is weak or range-bound. −DI (29.7) is above +DI (23.7), giving bears a mild edge. [Weak Trend, Bearish lean]
- Volume: 11.02M, ordinary compared with the huge Oct 30 capitulation spike. The Nov 13 gap-down came on moderate volume with no follow-through, and there is no volume expansion either way. [Neutral / No conviction]
DIVERGENCES & TRENDS
- The long-term trend is firmly bearish: a collapse from about $117 to the low $50s, with price below both the SMA50 and SMA200 and the SMA50 still well above the SMA200 as it rolls over.
- The short-term bearish signals are the EMA10/EMA20 bearish cross, the MACD bearish cross, and −DI above +DI since Nov 13.
- CMF stays positive and price is above VWAP ($58.78), so dip buying is showing up. This is a mild positive divergence against the weak price and MACD.
- RSI made a higher low at 39 on Nov 13, versus about 30 earlier in the month, and the lows in price have also risen (about $52 to about $57.8). That supports base-building, but price is still capped under the EMAs.
- ADX is falling from 25 to 19, so the trend is losing steam. This favors a range rather than a sharp move.
CHART PATTERNS
- Price has formed a base or rectangle between about $52 and $64 after a steep decline. In the diagram this is closest to a bearish flag/pennant continuation if support breaks, and to a bullish double bottom or rectangle if resistance breaks.
- Rising lows ($52 → about $55 → $57.8) hint at a bullish base. However, the lower highs under the falling EMAs and the failed rally at $62.5 keep the continuation-lower reading slightly ahead.
- Pattern targets: a breakdown below $57.46 and then $55 projects toward $52. A breakout above $62.5 projects toward $64.7 and then the $67 gap area.
POTENTIAL SCENARIOS
- Scenario 1: Bearish Rejection at EMAs, Drift Lower — Price stays capped under the EMA20 and MACD stays below its signal line, so the market tests the lower Bollinger Band area. Trigger: failure to reclaim $59.99 and a close below $57.46. Target: $55.30–$58.20. Invalidation: a daily close above $62.50. (45% probability)
- Scenario 2: Bullish Base Breakout — Positive CMF and the series of higher lows carry price back through the EMAs and to the upper band. Trigger: a close above $60.00, then $62.50. Target: $62.50–$64.60. Invalidation: a close below $57.46. (35% probability)
- Scenario 3: Neutral Range Chop — Weak ADX and compressed bands keep price oscillating between about $57.5 and $62. Trigger: no break of either boundary. Target: $59–$60. Invalidation: a decisive close outside $57.46–$62.50. (20% probability)
PRICE TARGETS
- Target Price: $58.20 (13-day)
- Expected Range: $55.30 to $61.50 (width $6.20, about 10.4% of the current price, consistent with the 8–12% guidance for 13 days)
- Key Levels: Support at $57.46 (lower Bollinger Band), Resistance at $62.50 (recent swing high; the EMA20 at $59.99 is minor near-term resistance)
OVERALL BIAS
OVERALL BIAS: BEARISH - The EMA10/EMA20 and MACD bearish crosses, −DI above +DI, and price trapped below the EMAs and far under the SMA50/SMA200 outweigh the mildly positive CMF and the VWAP hold. Conviction is modest because ADX is weak and a base is forming.
This is educational analysis and not financial advice.