MU 13-day bullish forecast — Nov 15, 2026
- Bias: Bullish
- Timeframe: 13 days (made Nov 15, 2026, target date Nov 27, 2026)
- Price at analysis: $778.40
- Price target: $796.00
- Expected range: $740.00 – $815.00
- Result: Pending — graded after the close on Nov 27, 2026
Get a free AI analysis of MU today
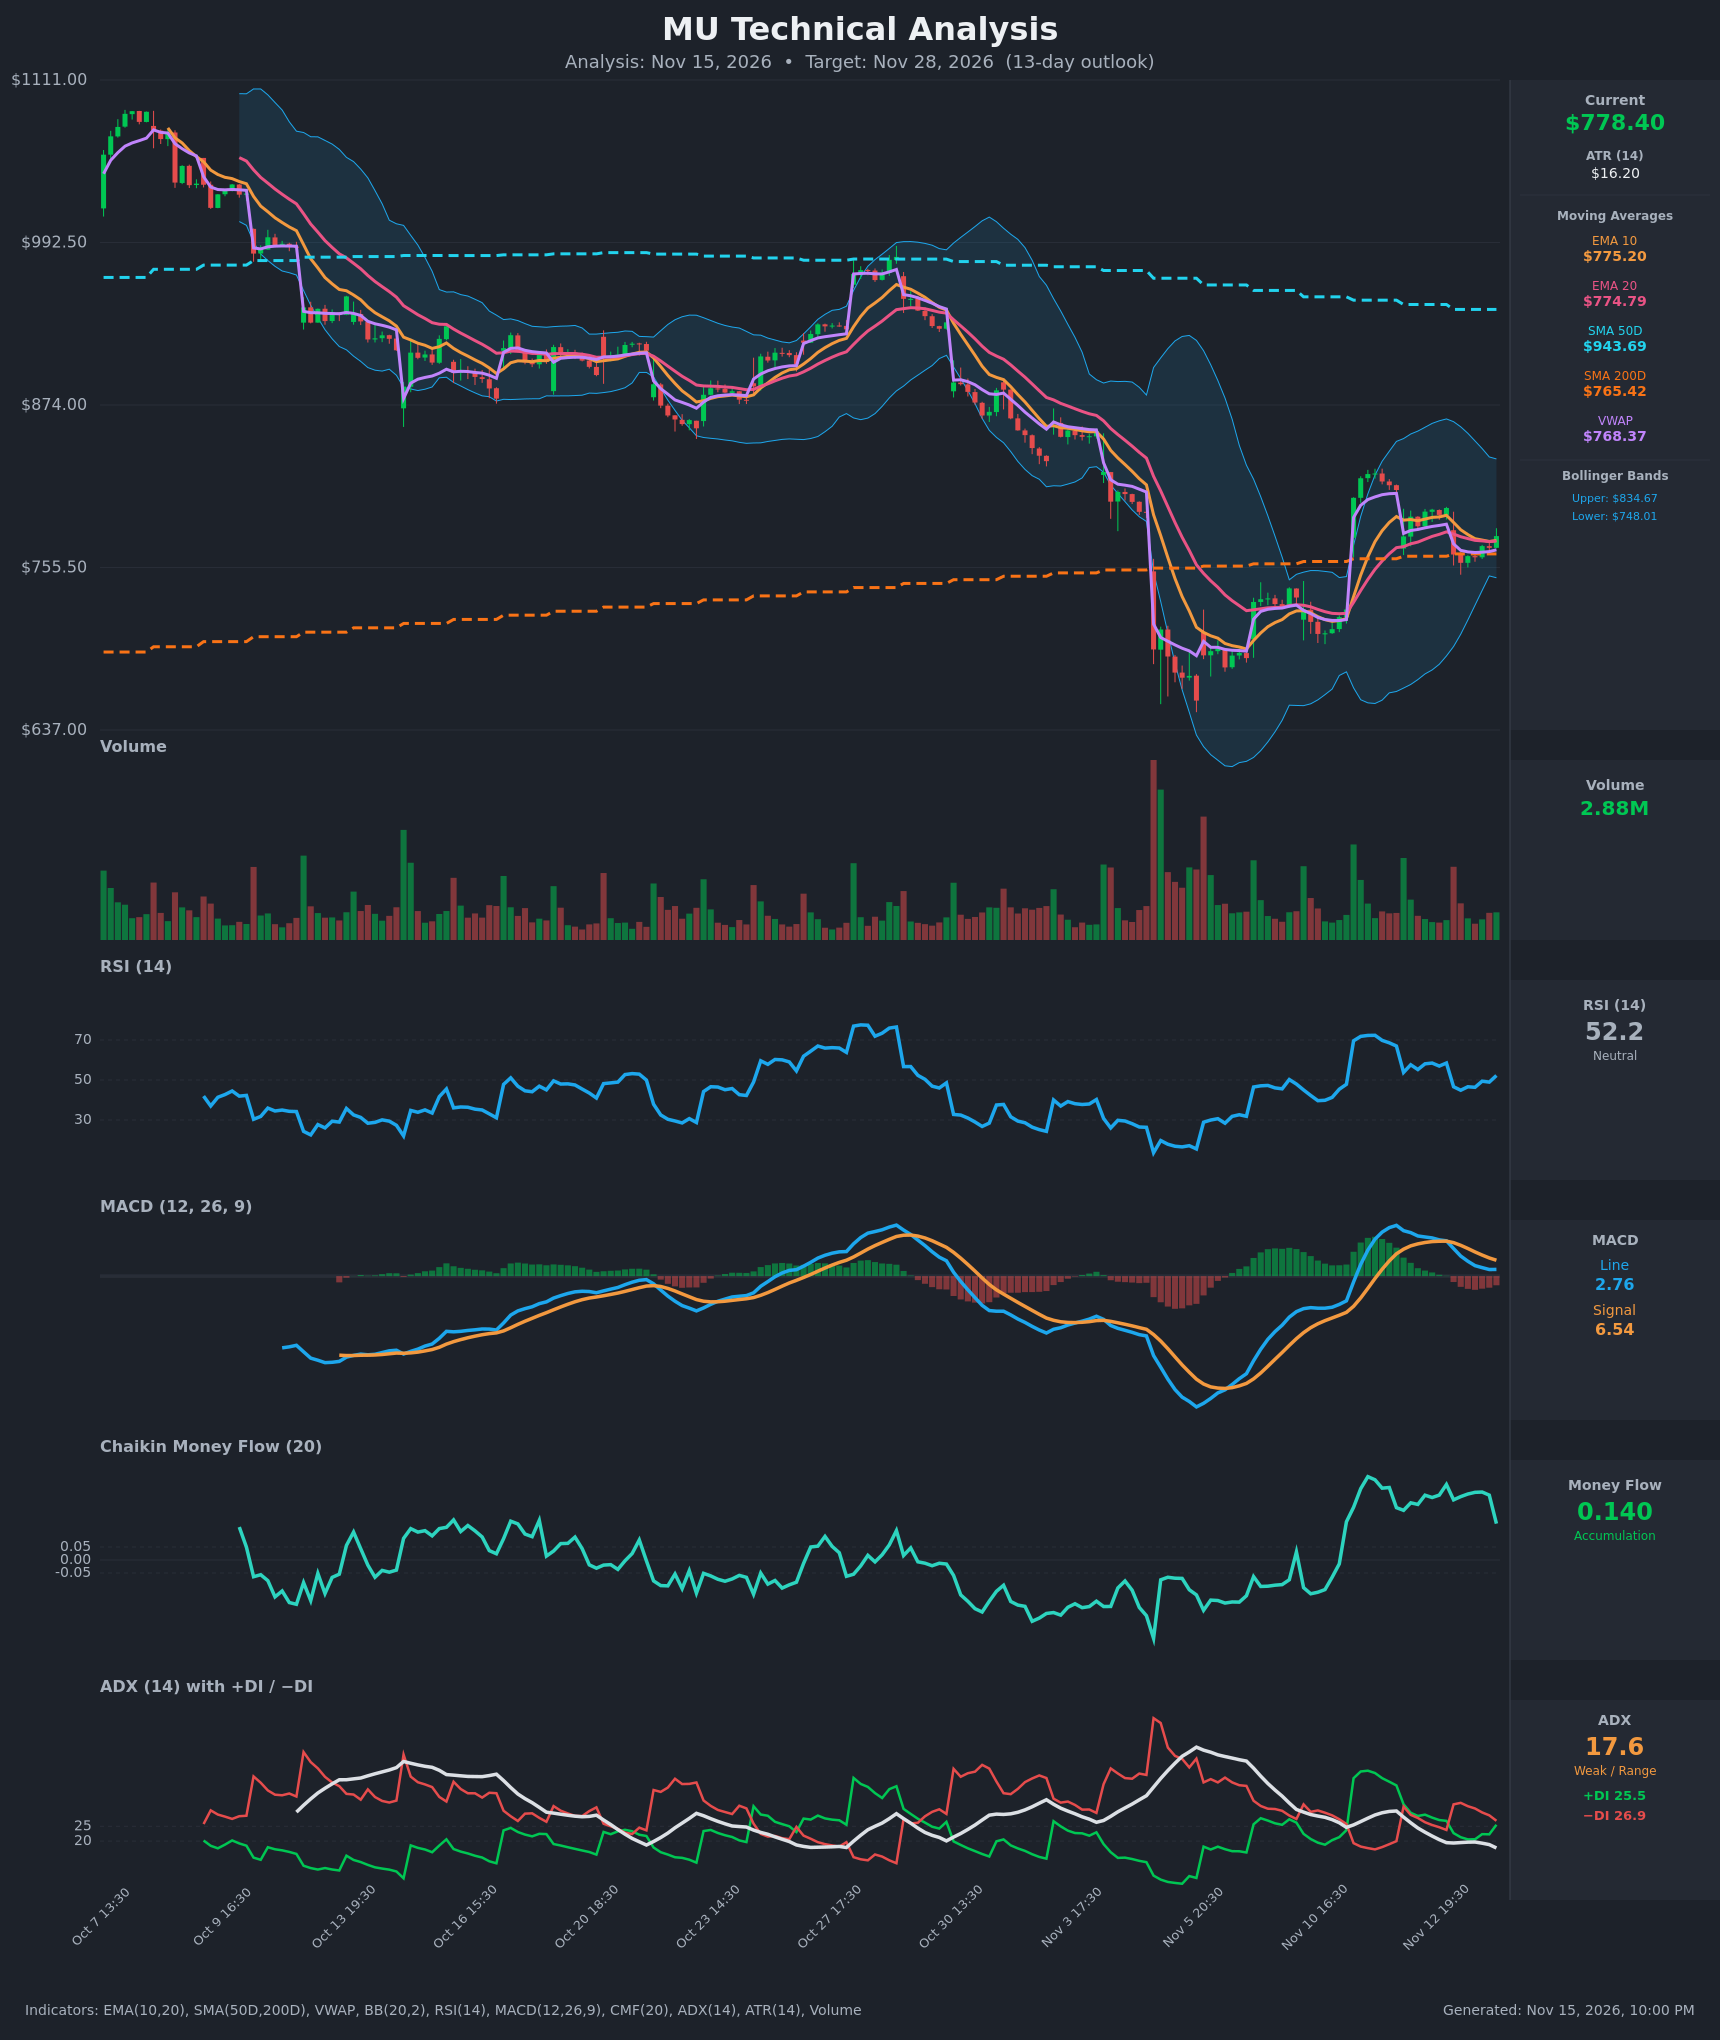
Analysis
TECHNICAL INDICATORS
- RSI (14): 52.25, neutral. It dipped to about 45 on Nov 13 and has recovered to 52, so short-term momentum is turning up from a mid-range base. [Neutral]
- 20 EMA: $774.79. Price ($778.40) sits just above it, and EMA10 ($775.20) is barely above EMA20. The two are nearly flat and converged, so this is a marginal support zone rather than a clear trend. [Neutral]
- MACD: Line 2.76 is below Signal 6.54, a bearish crossover that happened on Nov 13. The histogram is about -3.8 and has narrowed for three bars from -5.7, and the line has stopped falling (2.72 to 2.76). Bearish in position, but downside momentum is fading. [Bearish]
- Bollinger Bands (20): Upper $834.67, lower $748.02, midline about $791. Price is in the lower-middle half of the band. The bands are wide after the volatile selloff and spike, so there is room in both directions and no squeeze or band-walk. [Neutral]
- CMF (20): 0.140, above the +0.05 threshold and positive for the entire recent window (0.19-0.29). It dipped from 0.26 on the last bar, but accumulation persists despite the choppy price. [Accumulation]
- ADX (14): 17.6 and falling, so the trend is weak and range-bound. -DI (26.9) is only marginally above +DI (25.5) and the gap has closed from 10 points to about 1.4, so neither side controls. [Weak Trend, slight bearish DI lean]
- Volume: 2.88M, quiet and below the spike volumes seen at the Nov 5-6 capitulation low and the Nov 10 gap-up. Low volume during the consolidation means no strong conviction yet. [Neutral / consolidation]
DIVERGENCES & TRENDS
- Long-term trend: Bearish. Price is far below the falling SMA50 ($943.69) after a drop from about $1,070 to about $650. No golden or death cross is imminent, since the SMA50 is already well above the SMA200 ($765.42).
- SMA200: Price is holding just above it ($765.42 and rising), which keeps the long-term structure intact for now. This is the key pivot.
- VWAP: Price ($778.40) is above VWAP ($768.37), a mild buying-pressure signal that is recovering after being under it on Nov 13.
- Mild bullish divergence: CMF stays strongly positive (0.14) while price has gone sideways to lower since Nov 12. RSI made a higher low (about 45 on Nov 13) compared with the deeper oversold levels near the Nov 5 low.
- Bearish counterpoint: The MACD crossover down and -DI above +DI show the Nov 10 spike has faded into a pullback. Highs are lower in the short term ($812 to $799).
- Short term: EMA10/20 have converged and flattened, so a decisive break from the $758-$812 range is likely to set the direction.
CHART PATTERNS
- Primary read: A rectangle / tight consolidation (about $758-$812) after the sharp Nov 10 gap-up, resembling a bullish pennant/flag base. The pole is the rally from about $710 to $810. The continuation target is about $810 + $100 = $900+, though that is well beyond a 13-day horizon.
- Larger context: The trend since October is a descending channel with lower highs. The Nov 5-6 spike low (about $650) followed by a higher consolidation resembles the early stage of a bullish reversal (a falling-wedge-style exhaustion). It is not confirmed until price clears about $812-$835 (the upper Bollinger Band).
- Risk: A close below $758 and then the SMA200 would turn the consolidation into a bearish flag within the larger downtrend. The measured target would be around $700-$710.
POTENTIAL SCENARIOS
- Scenario 1: Bullish Range Breakout / Continuation — The MACD histogram keeps narrowing toward a bullish crossover, CMF accumulation persists, and price holds above the SMA200 and EMAs to retest the top of the range. Trigger: close above $799 with a push through $812 on rising volume. Target: $812-$835 (upper Bollinger Band). Invalidation: close below $758. (45% probability)
- Scenario 2: Neutral Range-Bound Chop — With ADX below 20 and DI lines converging, price oscillates between the SMA200 and the $800-$812 area. Trigger: failure to break either $758 or $812. Target: $765-$800. Invalidation: a daily close outside $750-$815. (28% probability)
- Scenario 3: Bearish Breakdown — The bearish MACD and -DI lean win out and the rally fades as a bear flag in the larger downtrend. Trigger: close below the SMA200 ($765.42) and then $758. Target: $720-$735, then the $700-$710 zone. Invalidation: reclaim of $800. (27% probability)
PRICE TARGETS
Timeframe: 13 days (Nov 28, 2026). The range width is $75.00, or about 9.6% of the $778.40 current price, which is in line with the 8-12% guidance for 14-21 days and about 2x a 2-3 day range.
- Target Price: $796.00 (13-day target)
- Expected Range: $740.00 to $815.00
- Key Levels: Support at $765.42 (SMA200, with $758 range low below), Resistance at $812.00 (range high, with the $834.67 upper Bollinger Band above)
OVERALL BIAS
OVERALL BIAS: BULLISH - Persistent CMF accumulation, price holding above the SMA200 and VWAP, and a narrowing MACD histogram favor a modest upside resolution of the consolidation toward $796-$812. Conviction is modest given the weak ADX and the bearish MACD crossover. A close below $758 would invalidate the view.
This is educational analysis and not financial advice.