USO 13-day bullish forecast — Nov 15, 2026
- Bias: Bullish
- Timeframe: 13 days (made Nov 15, 2026, target date Nov 27, 2026)
- Price at analysis: $145.59
- Price target: $148.20
- Expected range: $140.80 – $151.60
- Result: Pending — graded after the close on Nov 27, 2026
Get a free AI analysis of USO today
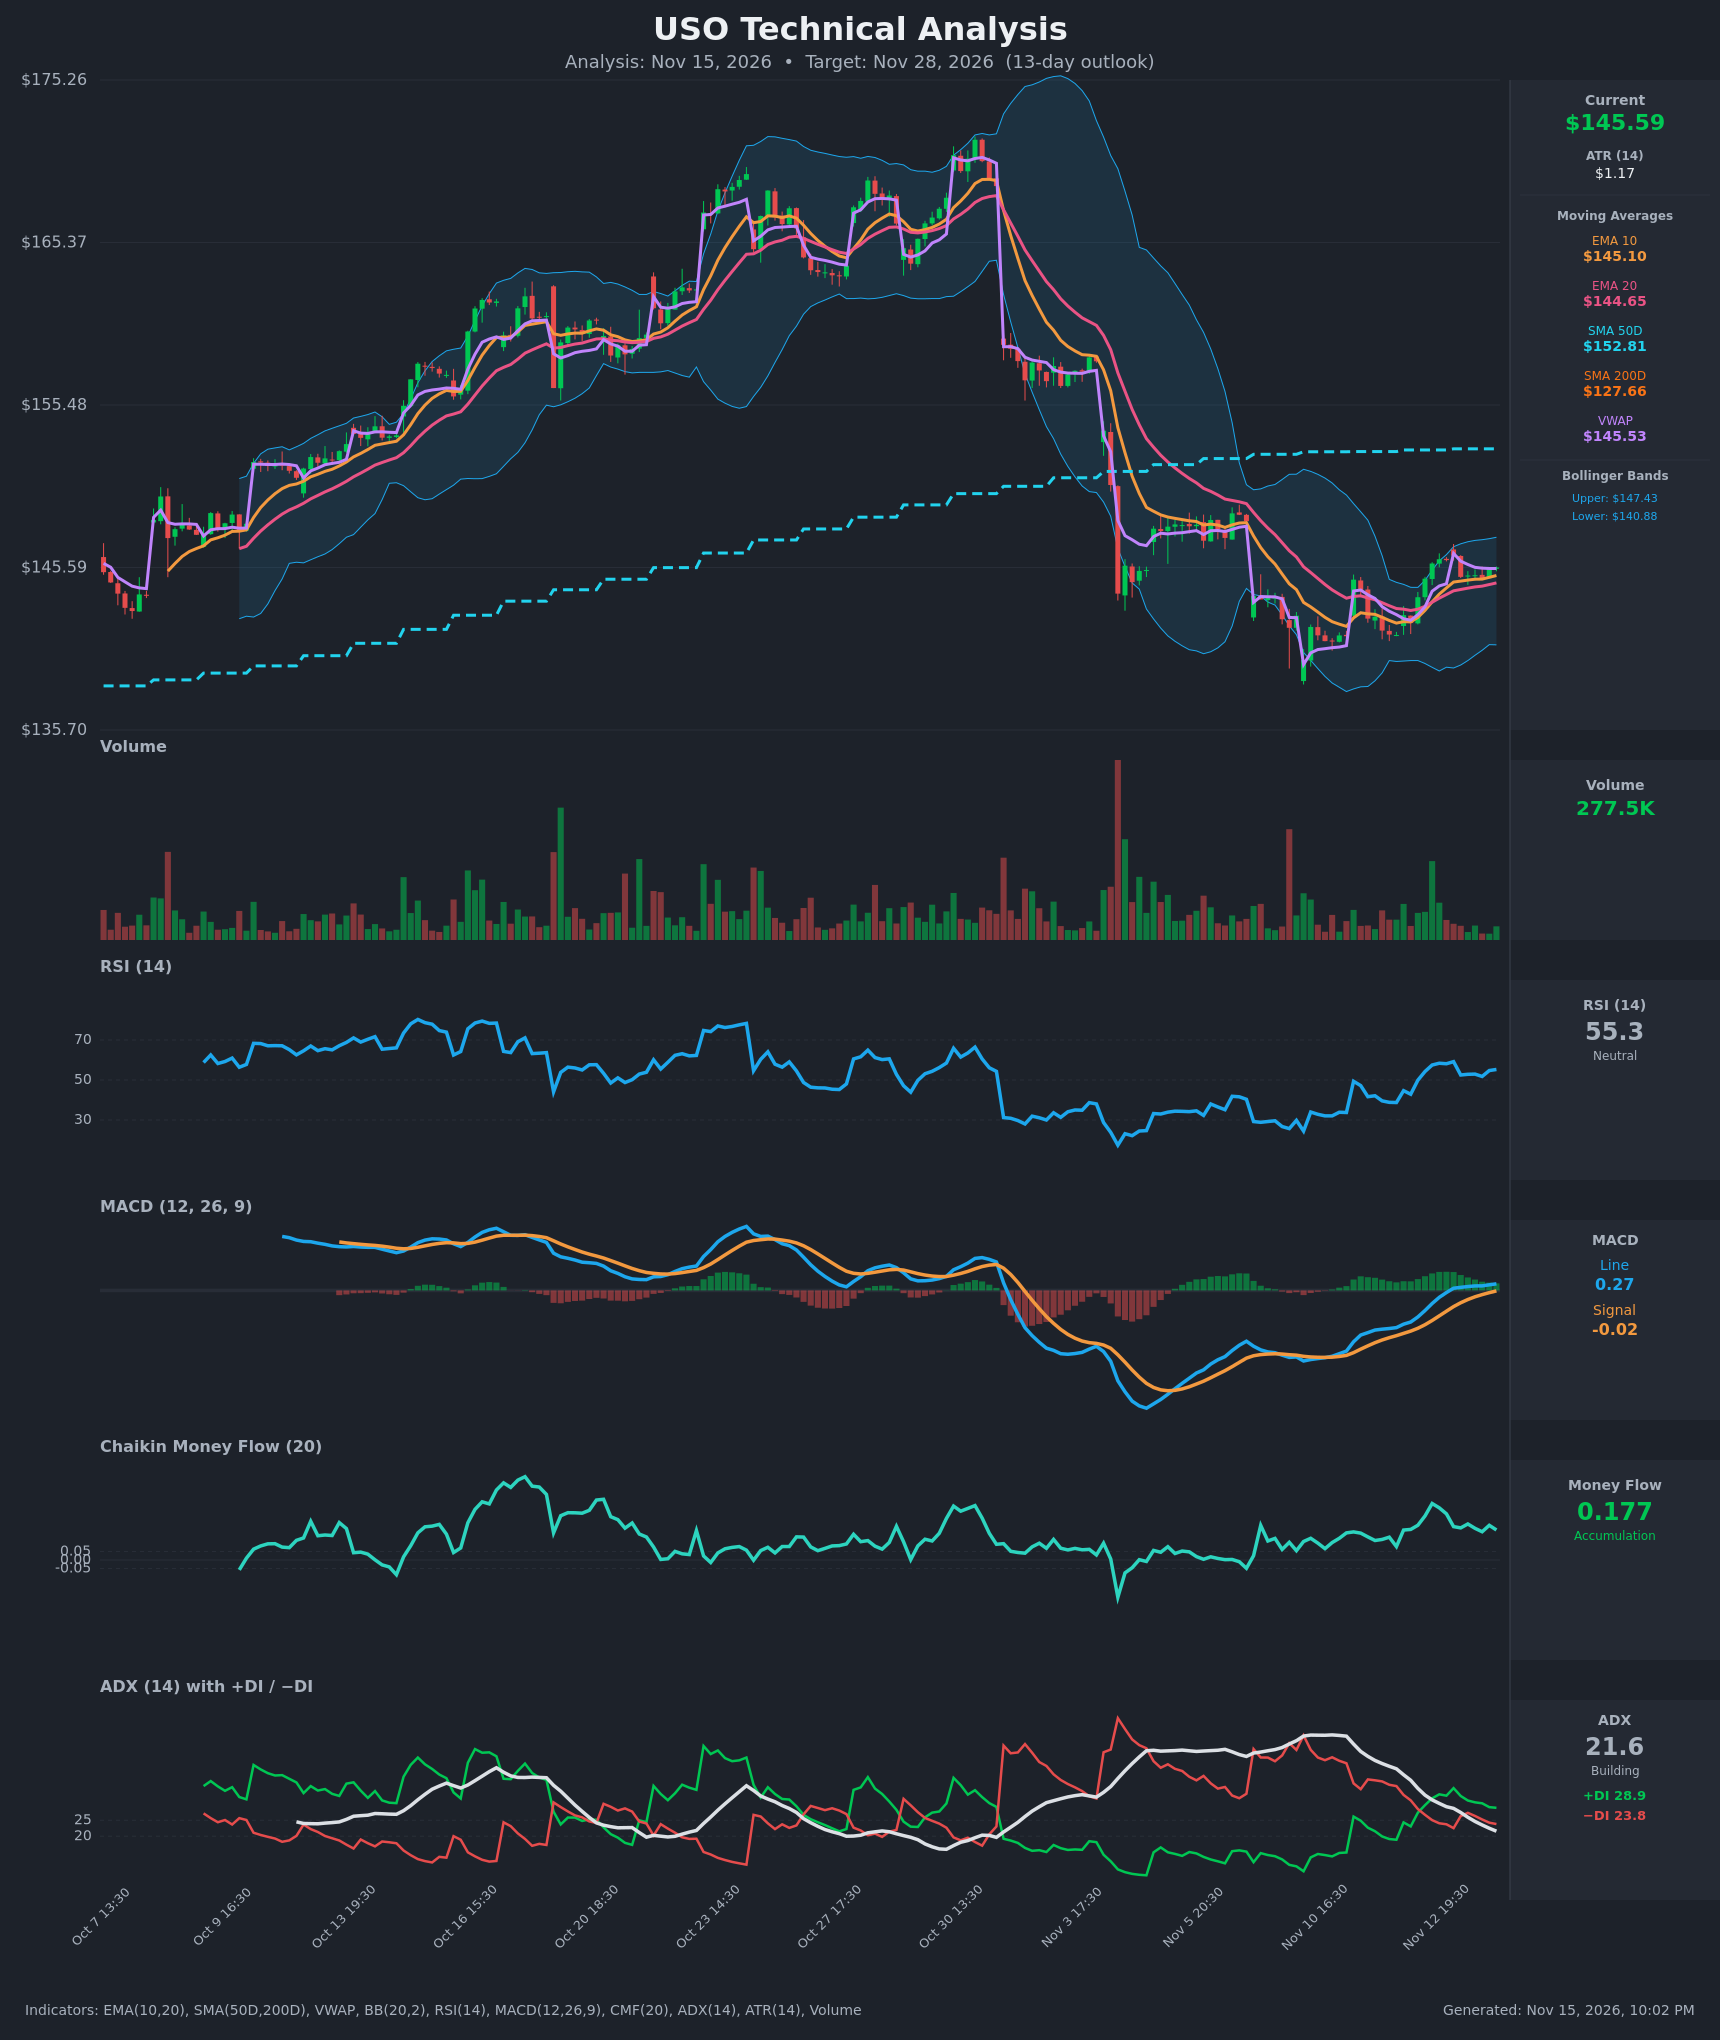
Analysis
TECHNICAL INDICATORS
- RSI (14): 55.27, up from the low 40s on Nov 12 and from the oversold zone (~25-30) in early November. It has room before the 70 level and sits above the 50 midline. [Bullish]
- 20 EMA: $144.65, with EMA10 at $145.10 above it. Price at $145.59 is above both, so the short-term averages act as support. The EMA10 is still pulling away from the EMA20 and has been above it since mid-Nov 12. [Bullish]
- MACD: Line 0.275 is above Signal -0.019 and has crossed above zero. The histogram is positive but the gap is narrowing slightly (the chart shows it peaking and rolling over). [Bullish]
- Bollinger Bands (20): Upper $147.43, lower $140.88, midline about $144.16. Price is above the midline in the upper half of the band. The bands have contracted sharply after the November volatility spike, which signals compression and a possible expansion ahead. [Neutral]
- CMF (20): +0.177, well above +0.05 and positive for most of the past week. This is persistent buying pressure even through the consolidation. [Accumulation]
- ADX (14): 21.6 and falling from 41, so the November downtrend has exhausted. +DI (28.9) is above −DI (23.8), giving bulls a slight edge, but ADX is below 25 and the gap between the DIs is narrowing. [Weak Trend, Bullish lean]
- Volume: 277.5K, light and drifting lower over the last few sessions. The recovery is not being confirmed by expanding volume, and there are no capitulation or breakout bars. [Neutral / lacks confirmation]
DIVERGENCES & TRENDS
- Price vs SMAs: Price ($145.59) is above the SMA200D ($127.66), so the long-term uptrend is intact. It is below the SMA50D ($152.81), which has flattened and now sits as overhead resistance. The 50/200 golden cross remains in place.
- EMA and MACD crossovers: EMA10 crossed above EMA20 on Nov 12. MACD crossed above its Signal and above zero on Nov 13 (0.092 vs -0.674 and rising). Both are fresh bullish signals.
- Momentum: RSI made a higher low (about 38.7 to 52, then back to 55) while price made higher lows, which is constructive. There is no bearish divergence at present.
- VWAP: Price ($145.59) is just above VWAP ($145.53), so buyers hold a very slight edge.
- ADX: ADX has fallen from 41 to 21.6 while +DI crossed above −DI on Nov 12. This is a trend transition from a bearish downtrend toward a base, not yet a confirmed new uptrend.
- Other: The sharp decline from about $171 to about $140 was a major breakdown. The 13-day outlook is a bounce within that larger correction, with room to retrace toward the SMA50D.
CHART PATTERNS
- Bullish Double Bottom (developing): Lows near $139.5-$141 in early November, retested near $141.5 on Nov 11-12, with a neckline around $146.30 (the Nov 13 high). A close above the neckline would give a measured target of about $152 (neckline + pattern depth), which aligns with the SMA50D at $152.81.
- Base or small rounding bottom: Price is building a rounded base after the capitulation drop, with MACD and RSI turning up. This supports a reversal bias.
- Caveat: Price is trapped between the upper Bollinger Band ($147.43) and the EMAs. A failure at $146.3-$147.4 would turn this into a lower-high range, a mild bearish risk.
POTENTIAL SCENARIOS
- Scenario 1: Bullish Neckline Breakout — Price clears $146.30 and the upper band at $147.43 with improving volume, and the double-bottom/base reversal extends toward the SMA50D. Trigger: close above $147.45 on rising volume. Target: $148.50-$152.00. Invalidation: close below $143.80, under the EMA20 and recent swing lows. (50% probability)
- Scenario 2: Neutral Range Consolidation — Price chops between the EMA20 and upper band as ADX stays below 20 and the Bollinger Bands stay tight. Trigger: repeated failures at $147 and holds above $144. Target: $143.50-$147.00. Invalidation: close outside either end of the range. (25% probability)
- Scenario 3: Bearish Failure at Resistance — The bounce fades on low volume, MACD rolls back toward the signal line, and price falls through the EMA20. Trigger: close below $144.00. Target: $140.90 (lower band), possibly $139.50. Invalidation: close above $147.50. (25% probability)
PRICE TARGETS
- Target Price: $148.20 (13 days)
- Expected Range: $140.80 to $151.60 (width $10.80, about 7.4% of current price, in line with a ~13-day horizon; the ATR of $1.17 supports this)
- Key Levels: Support at $144.65 (EMA20), with deeper support at $140.88. Resistance at $147.43 (upper Bollinger Band), then $152.81 (SMA50D).
OVERALL BIAS
OVERALL BIAS: BULLISH - Fresh EMA10/EMA20 and MACD bullish crossovers, CMF accumulation at +0.177, +DI above −DI, and a developing double-bottom base above the rising SMA200D outweigh the weak ADX, light volume, and overhead SMA50D resistance. Conviction is modest because the $146.30-$147.43 resistance cluster still has to be cleared.
This is educational analysis and not financial advice.