PFE 20-day bearish forecast — Nov 15, 2026
- Bias: Bearish
- Timeframe: 20 days (made Nov 15, 2026, target date Dec 4, 2026)
- Price at analysis: $28.89
- Price target: $28.40
- Expected range: $27.00 – $30.20
- Result: Pending — graded after the close on Dec 4, 2026
Get a free AI analysis of PFE today
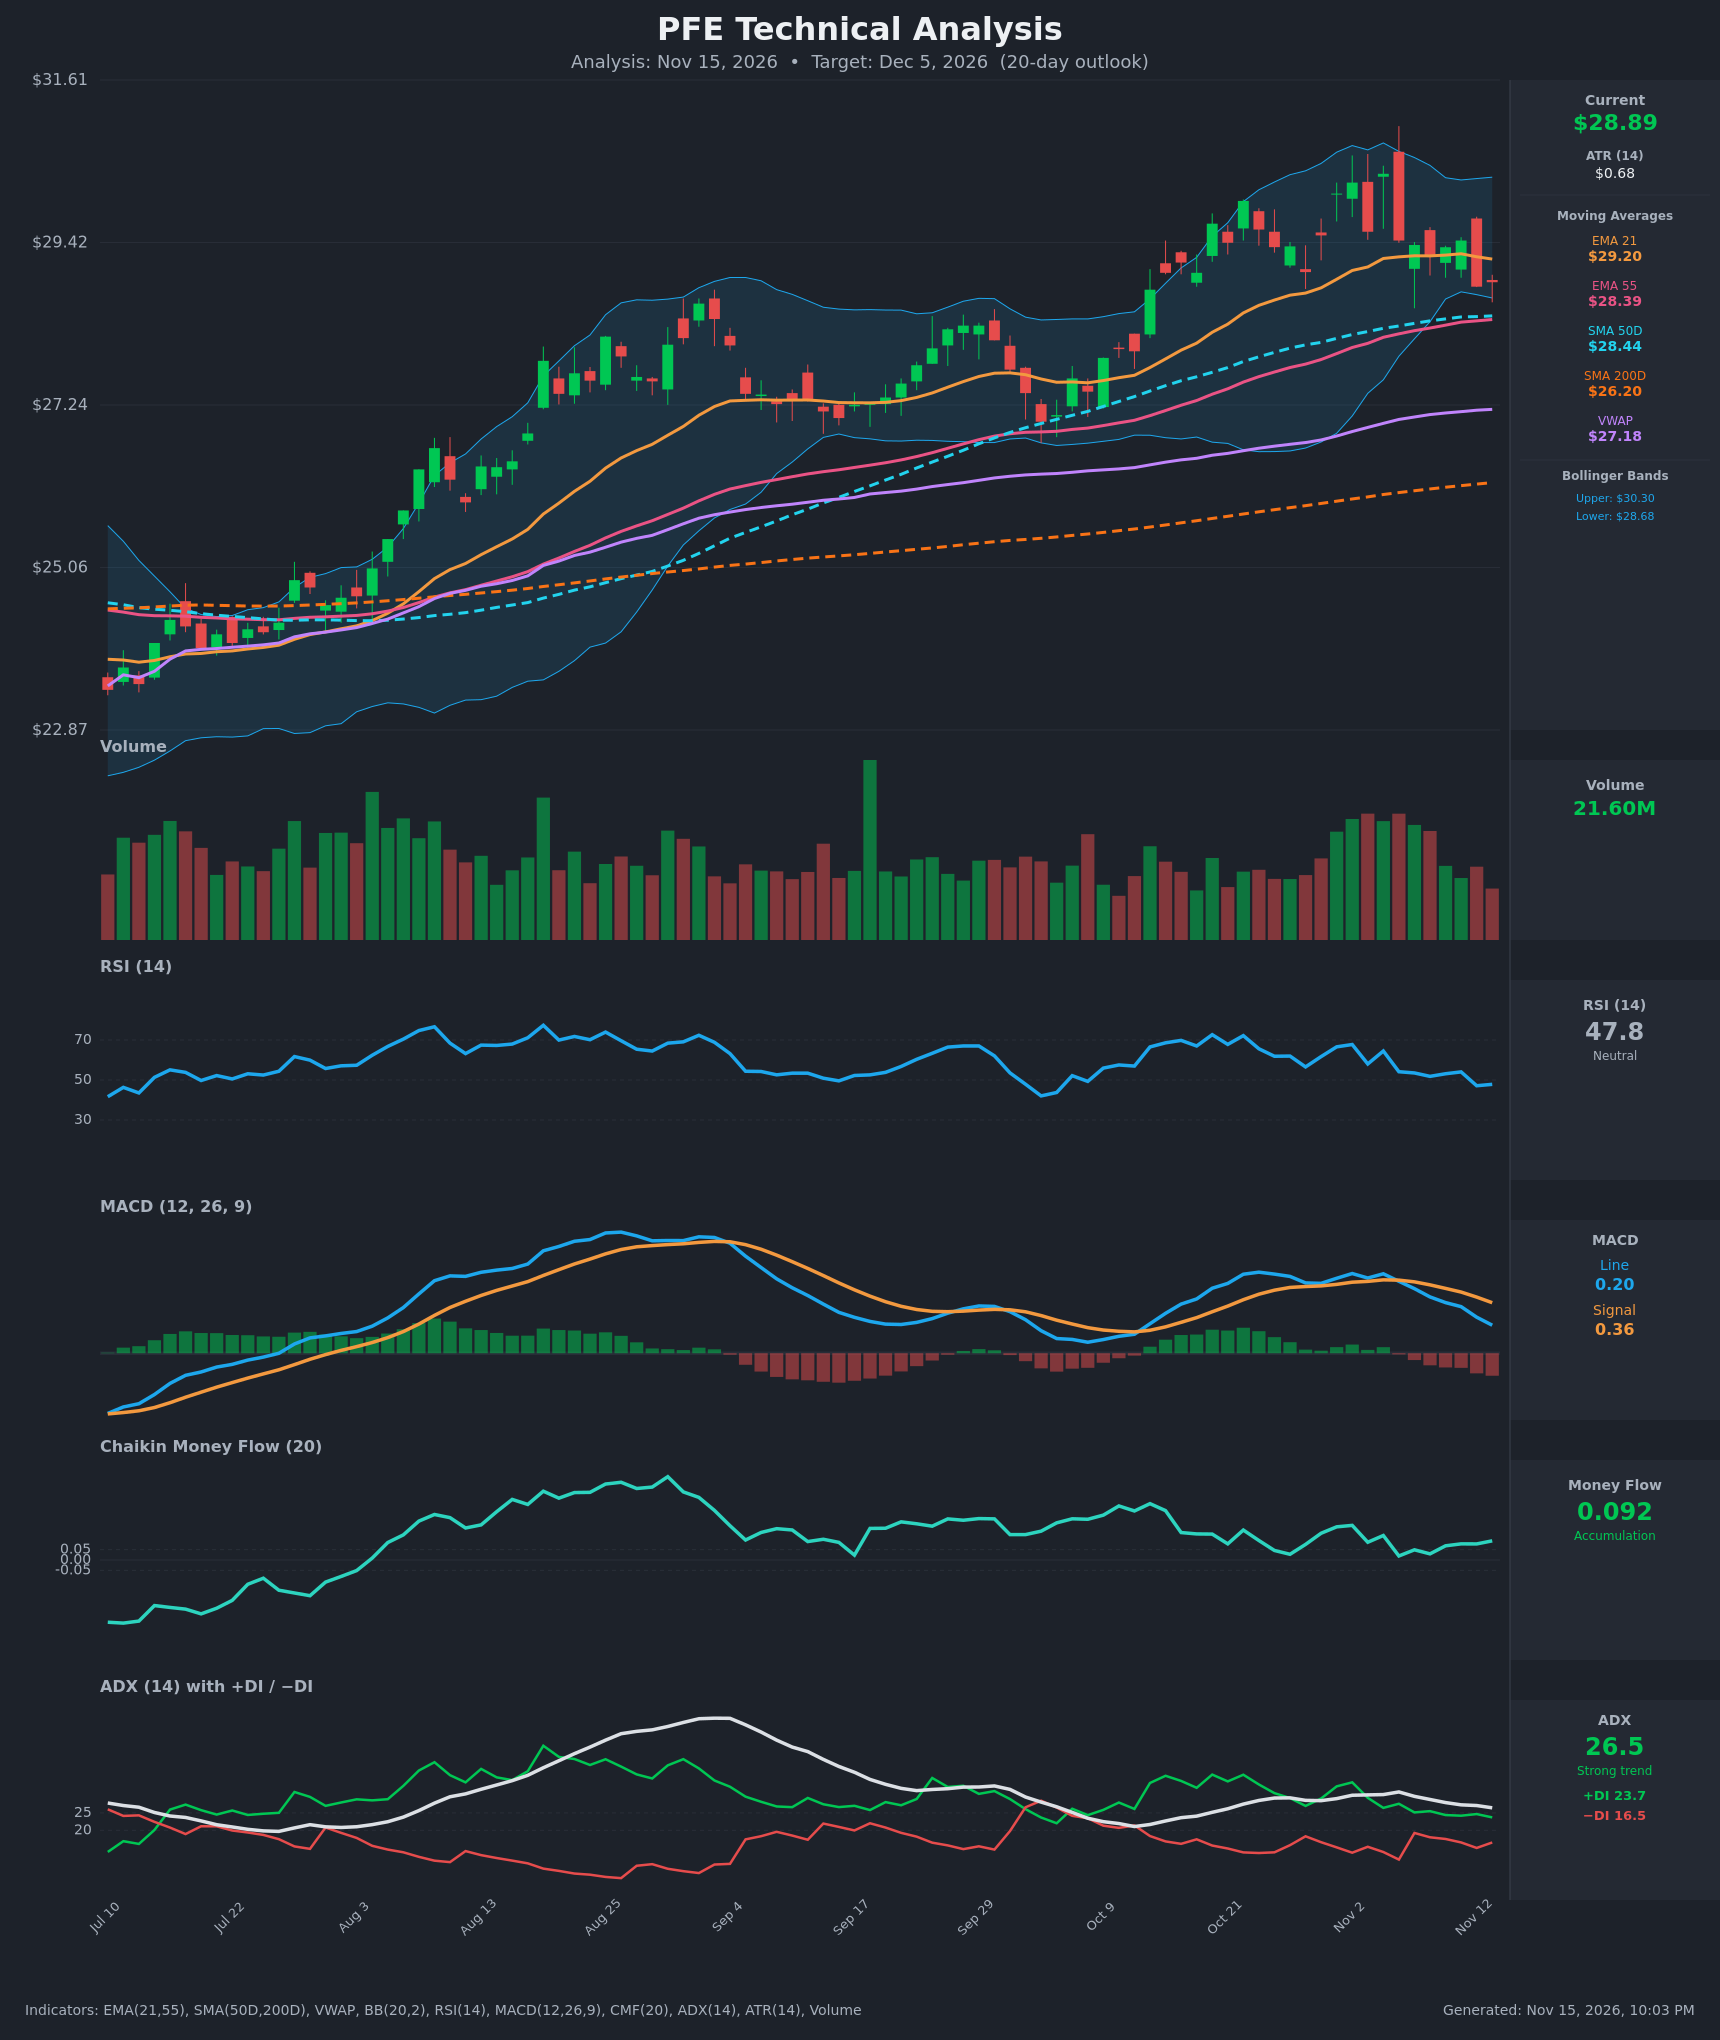
Analysis
TECHNICAL INDICATORS
- RSI (14): 47.83, down from 67.7 on Nov 2 and just below the 50 midline. The reading is neutral, and momentum has been fading steadily for about two weeks. [Bearish]
- 20 EMA (EMA 21): $29.20. Price at $28.89 is below it, so it now acts as overhead resistance. Price lost it on Nov 12 after riding above it for most of the prior month. The EMA 21 is still above EMA 55 ($28.39), so the broader trend structure is intact. [Bearish]
- MACD: Line 0.202 is below Signal 0.365, a bearish crossover that occurred around Nov 5-6. The line has fallen from 0.575 to 0.202 and the histogram is increasingly negative. The line is still above zero, so this is a pullback rather than a full trend reversal. [Bearish]
- Bollinger Bands (20): Upper $30.30, lower $28.68. Price at $28.89 sits in the bottom ~13% of the band, close to the lower band. The bands are rolling over after the push to the upper band near $30.35. A tag of the lower band could produce a short-term bounce, but it also signals the failed upper-band run. [Neutral]
- CMF (20): +0.092, above the +0.05 threshold, so buying pressure persists despite the price dip. It has faded from 0.167 on Nov 2 but remains positive. This is the main bullish counterpoint to the momentum indicators. [Accumulation]
- ADX (14): 26.5 and slowly declining from 31, with +DI 23.7 above −DI 16.5. The trend is still technically strong and bullish-led, but the gap is narrowing and ADX is rolling over, which points to a maturing trend and consolidation. [Strong Trend, bullish but weakening]
- Volume: 21.60M, mixed to below the heavier volume seen during the late-October rally. Recent red candles, including the large Nov 12 reversal bar, carry as much volume as the green ones. The bounce attempts lack conviction. [Neutral to slightly bearish]
DIVERGENCES & TRENDS
- Bearish momentum divergence: Price made a high at $30.35 on Nov 4 with MACD at 0.573 and RSI at 64.5. MACD and RSI have since dropped sharply and price has followed. The Nov 4 high came with lower RSI than the Oct 30-Nov 2 readings (66-68).
- Crossovers: The bearish MACD crossover is confirmed. Price crossed below EMA 21 on Nov 12.
- Long-term trend: EMA 21 > EMA 55 > SMA 50D > SMA 200D, all rising, and price is well above SMA 200D ($26.20) and VWAP ($27.18). The golden cross occurred long ago. The larger uptrend is intact, so any pullback has plenty of support below.
- Support cluster: EMA 55 ($28.39) and SMA 50D ($28.44) sit about 1.5% below price and form the first real test.
- DI spread: The +DI/−DI gap has narrowed from about 17 points to about 7, and ADX is declining.
CHART PATTERNS
- Bearish Double Top (reversal): The highs at ~$30.08 (Oct 30) and ~$30.35 (Nov 4) around the upper Bollinger Band, with a neckline near $29.2-29.4. The Nov 12 close at $28.83 broke below that neckline. The measured move is the pattern height (~$1.15) subtracted from the neckline, giving ~$28.05. This is a modest pattern and needs follow-through to confirm.
- Context: Within the larger uptrend, this reads as a corrective pullback or consolidation, not a major reversal. The rising SMA 50D/EMA 55 cluster near $28.4 is likely where buyers step in.
POTENTIAL SCENARIOS
- Scenario 1: Bearish Pullback to Moving-Average Support — Double-top breakdown with negative MACD momentum drives price back to the EMA 55/SMA 50D cluster, with a possible overshoot toward the measured-move area. Trigger: daily close below $28.68 (lower band) and failure to reclaim $29.20. Target: $28.40, with an extension to $28.00. Invalidation: a daily close above $29.40 with MACD turning up. (50% probability)
- Scenario 2: Bullish Support Hold and Recovery — CMF accumulation and the intact uptrend lead dip buyers to defend the $28.4-28.7 zone, and price recovers back toward the upper range. Trigger: bounce from the lower band and a close above the EMA 21 ($29.20). Target: $29.80-$30.30. Invalidation: a close below $28.30. (35% probability)
- Scenario 3: Neutral Chop — Price oscillates between the $28.4 support cluster and $29.2-29.4 resistance as ADX fades. Trigger: no decisive break of either level. Target: $28.60-$29.20. Invalidation: a close outside $28.20-$29.60. (15% probability)
PRICE TARGETS
- Target Price: $28.40 (20-day, Dec 5, 2026)
- Expected Range: $27.00 to $30.20 (width $3.20, about 11% of current price, consistent with the 14-21 day guidance)
- Key Levels: Support at $28.40 (EMA 55/SMA 50D cluster), Resistance at $29.20 (EMA 21)
OVERALL BIAS
OVERALL BIAS: BEARISH - Price broke below the EMA 21 and the double-top neckline, MACD has crossed bearishly with a widening negative histogram, and RSI is below 50. The long-term uptrend and positive CMF limit the downside, so I expect a pullback toward the $28.40 support cluster rather than a collapse.
This is educational analysis and not financial advice.