PFE 48-day bullish forecast — Nov 15, 2026
- Bias: Bullish
- Timeframe: 48 days (made Nov 15, 2026, target date Jan 1, 2027)
- Price at analysis: $28.89
- Price target: $29.50
- Expected range: $27.30 – $31.20
- Result: Pending — graded after the close on Jan 1, 2027
Get a free AI analysis of PFE today
Analysis
TECHNICAL INDICATORS
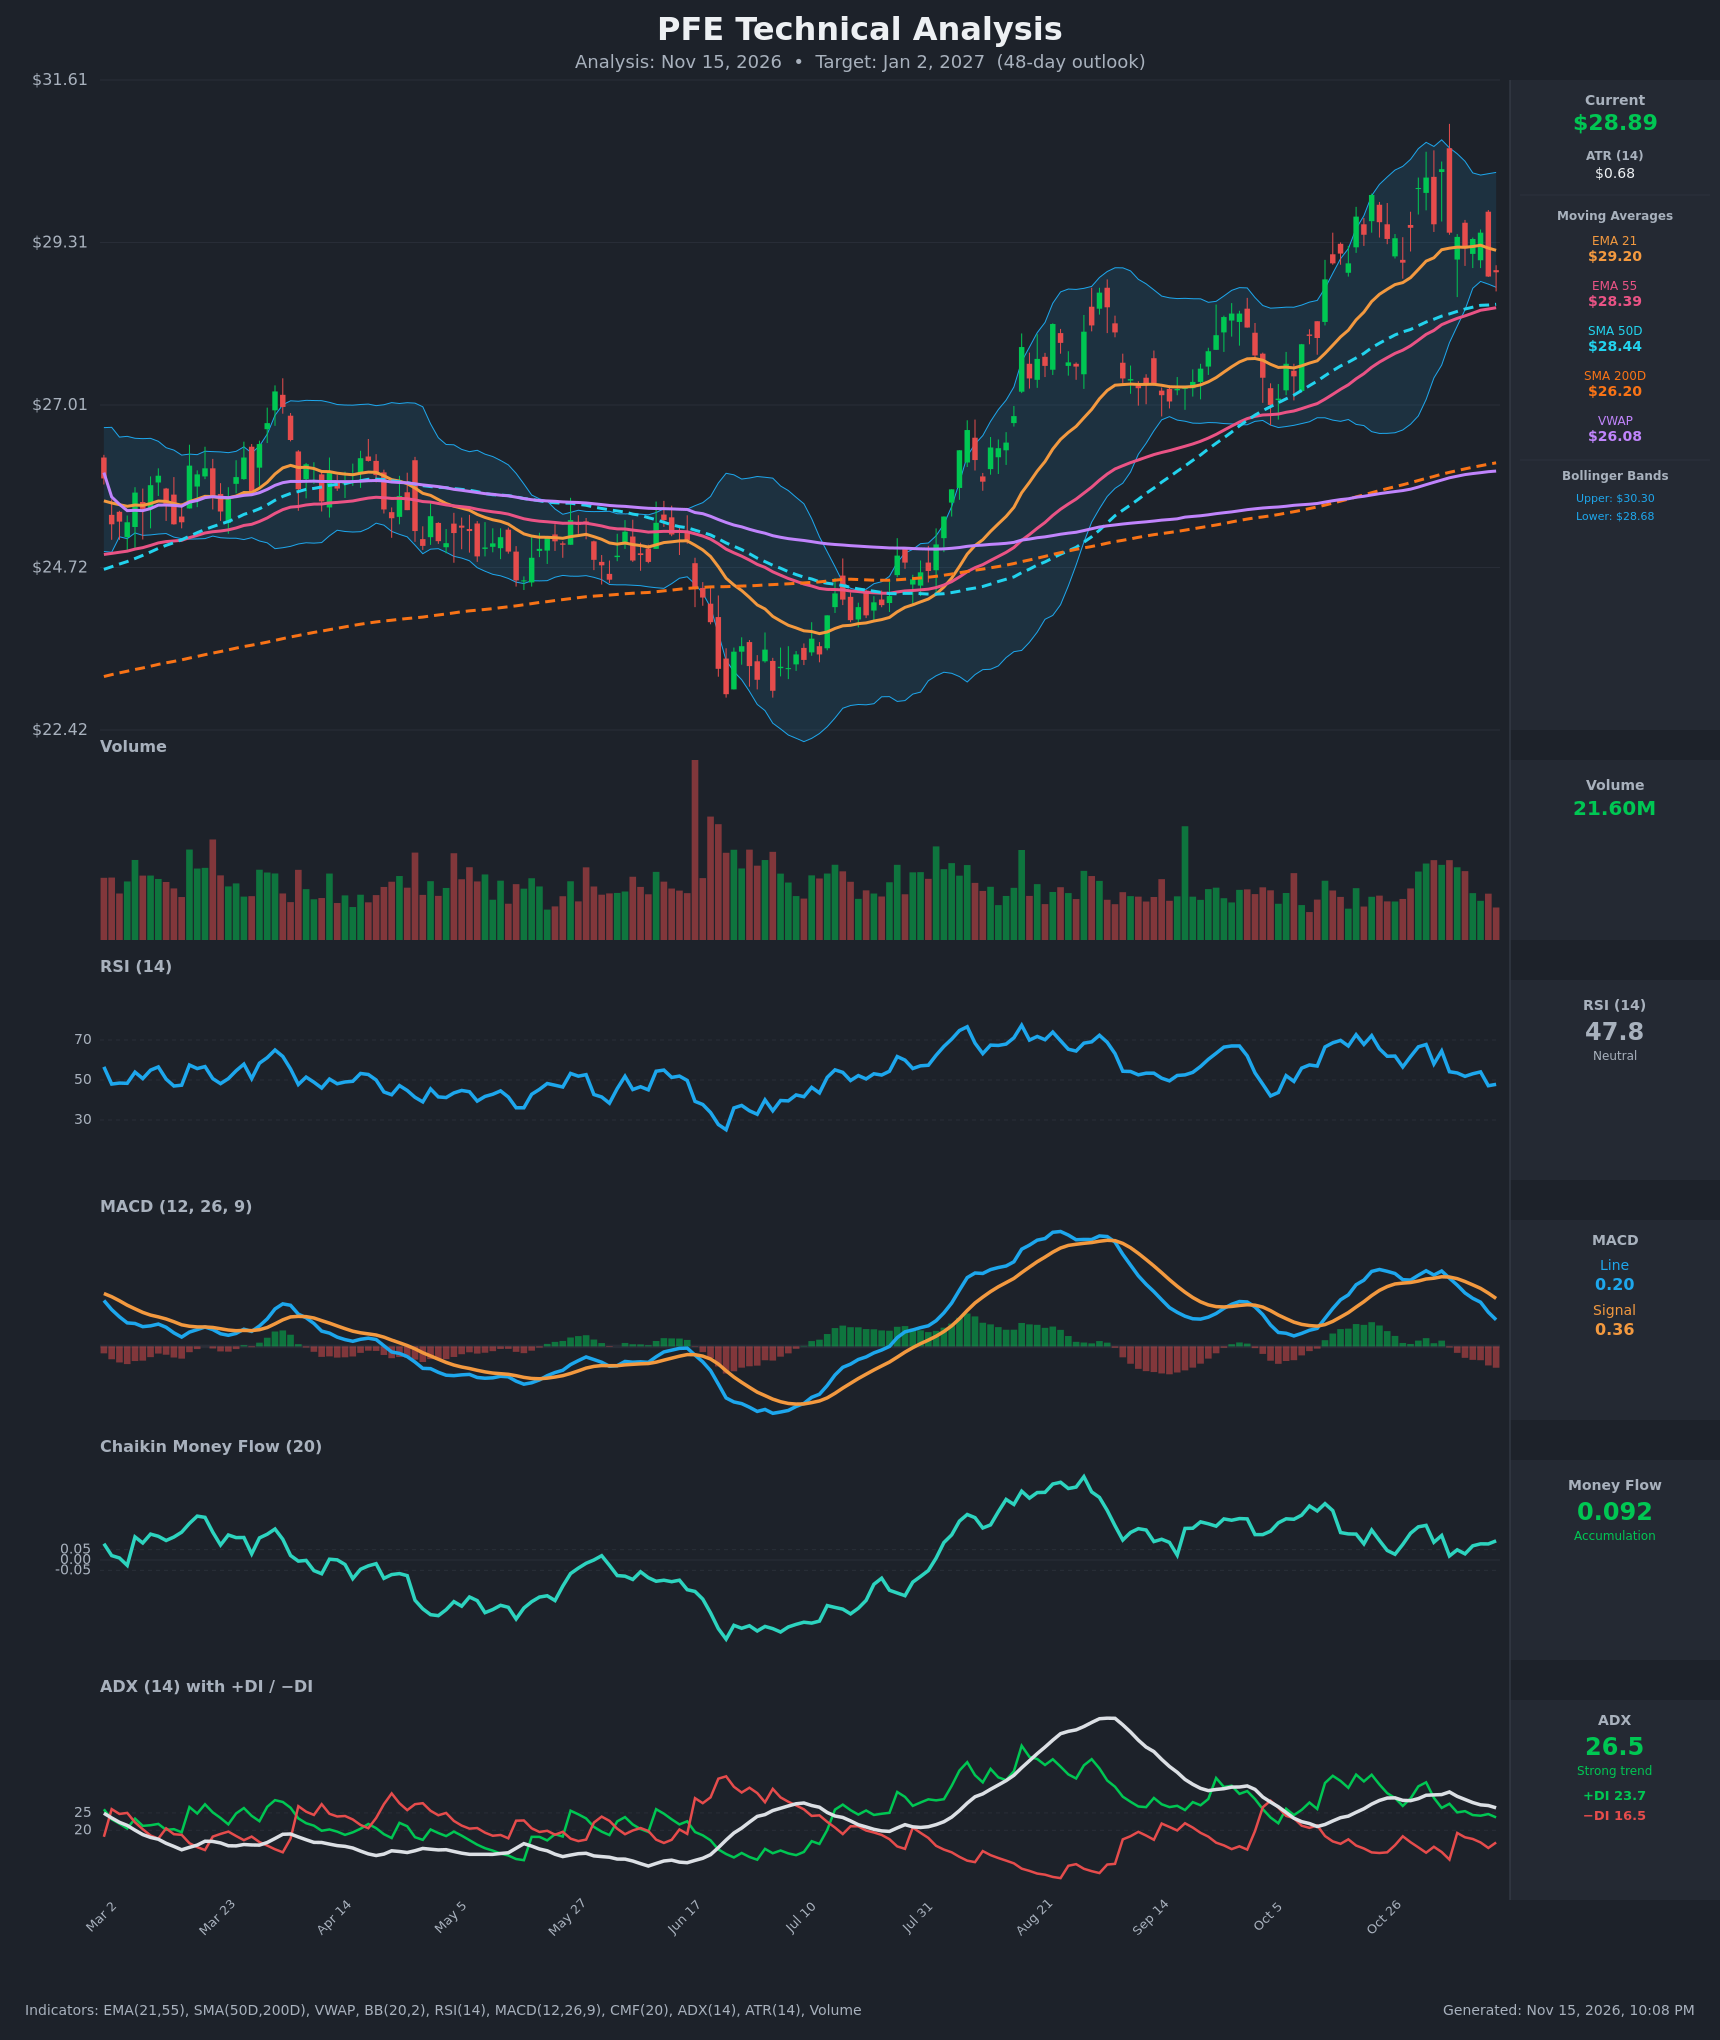
- RSI (14): 47.83, down from the 60s in late October (67.7 on Nov 2) and now just below the 50 midline. Momentum has cooled, but the reading is nowhere near oversold. [Neutral]
- 20 EMA (EMA 21): $29.20, with price at $28.89 just below it. The EMA21 has flattened and is now short-term resistance. Price still sits above EMA55 ($28.39), and EMA21 is above EMA55, so there is no bearish EMA cross. [Bearish]
- MACD: Line 0.20 is below Signal 0.36, and the histogram is negative and widening. The bearish cross happened around Nov 5-6, and both lines are falling. Both remain above zero, so this reads as a pullback within an uptrend and not a trend reversal. [Bearish]
- Bollinger Bands (20): Upper $30.30, lower $28.68. Price is near the lower band, about 0.2 from it, after being rejected near the upper band at $30.35. The bands are still wide. A close at the lower band can mean short-term support or the start of a band walk lower. [Neutral]
- CMF (20): 0.092, above the +0.05 threshold. It has stayed positive throughout the pullback, which suggests dip-buying and not heavy distribution. [Accumulation]
- ADX (14): 26.5, falling from 31 (Nov 5), with +DI 23.7 above −DI 16.5. The trend is still technically strong and bullish, but it is losing strength as the pullback matures. [Strong Trend, Bullish direction, weakening]
- Volume: 21.60M, in line with recent averages and with no capitulation spike. The red candles in the recent decline carry moderate volume, so selling is orderly. [Neutral to mildly cautious]
Other moving averages and VWAP:
- Price is well above SMA200D ($26.20) and VWAP ($26.08), which confirms a long-term uptrend.
- SMA50D ($28.44) is above SMA200D, so the golden cross is already in place, and SMA50D is still rising.
DIVERGENCES & TRENDS
- Momentum divergence: Price made a high at $30.35 on Nov 4, but the MACD peak (0.575) was equal to or lower than earlier peaks. RSI peaked at 67.7, below the roughly 75 reached in August. This is a mild bearish divergence at the swing high.
- Trend: The MACD crossover and the falling ADX show that the October rally is consolidating. Price is below EMA21 but holds above the EMA55/SMA50D cluster at $28.39-$28.44.
- CMF vs price: CMF is still positive while price corrects, a bullish offset to the weak MACD.
- Key break to watch: a daily close below $28.40 would break the confluence of EMA55 and SMA50D. Reclaiming $29.20 (EMA21) would signal the pullback is over.
CHART PATTERNS
- Possible Bearish Double/Triple Top (low confidence): The closes around $30.08, $30.23 and $30.35 form a shallow top near $30.30. The neckline sits near $28.4-$29.0. A confirmed break below $28.40 would imply a measured move of about $26.5-$27.0, close to the late-summer breakout zone and the SMA200D area.
- Flag-like pullback (bullish continuation): The October advance followed by an orderly, lower-volume pullback resembles a Bullish Flag. A breakout above $29.60-$30.00 would target about $31.5-$32.0, based on the roughly $3 pole.
- Neither pattern is confirmed yet, so the $28.40 support and $29.60 resistance decide which one plays out.
POTENTIAL SCENARIOS
- Scenario 1: Bullish Pullback Holds and Uptrend Resumes — Price finds support at the EMA55/SMA50D cluster ($28.40), supported by positive CMF and a rising SMA200D. MACD flattens and re-crosses upward as the trend resumes. Trigger: hold above $28.40 and a close above EMA21 ($29.20), then $29.60. Target: $30.30-$31.00. Invalidation: daily close below $28.30. (45% probability)
- Scenario 2: Bearish Double-Top Breakdown — The fading MACD, falling ADX and RSI below 50 extend into a break of the moving average cluster. Price rolls toward the SMA200D and VWAP zone. Trigger: close below $28.40 on rising volume. Target: $27.00-$27.50, with an extension toward $26.50. Invalidation: close back above $29.60. (35% probability)
- Scenario 3: Neutral Range Consolidation — Price chops between $28.40 and $30.00 for the full period as ADX drops below 20. Trigger: repeated failures at both $28.40 and $30.00. Target: $28.80-$29.50. Invalidation: a close outside the $28.30-$30.40 range. (20% probability)
PRICE TARGETS
- Target Price: $29.50 (48-day horizon)
- Expected Range: $27.30 to $31.20 (width $3.90, about 13.5% of the current price, consistent with the 30-60 day guideline of 12-18%)
- Key Levels: Support at $28.40, Resistance at $30.30
OVERALL BIAS
OVERALL BIAS: BULLISH - The long-term uptrend is intact (price above a rising SMA200D, golden cross in place, +DI above −DI, CMF in accumulation), and the pullback is testing the EMA55/SMA50D support cluster near $28.40. The negative MACD cross and sub-50 RSI point to near-term choppiness, so conviction is modest and a break below $28.40 would flip the picture.
This is educational analysis and not financial advice.