PFE 62-day bullish forecast — Nov 15, 2026
- Bias: Bullish
- Timeframe: 62 days (made Nov 15, 2026, target date Jan 15, 2027)
- Price at analysis: $28.89
- Price target: $30.00
- Expected range: $26.00 – $32.00
- Result: Pending — graded after the close on Jan 15, 2027
Get a free AI analysis of PFE today
Analysis
TECHNICAL INDICATORS
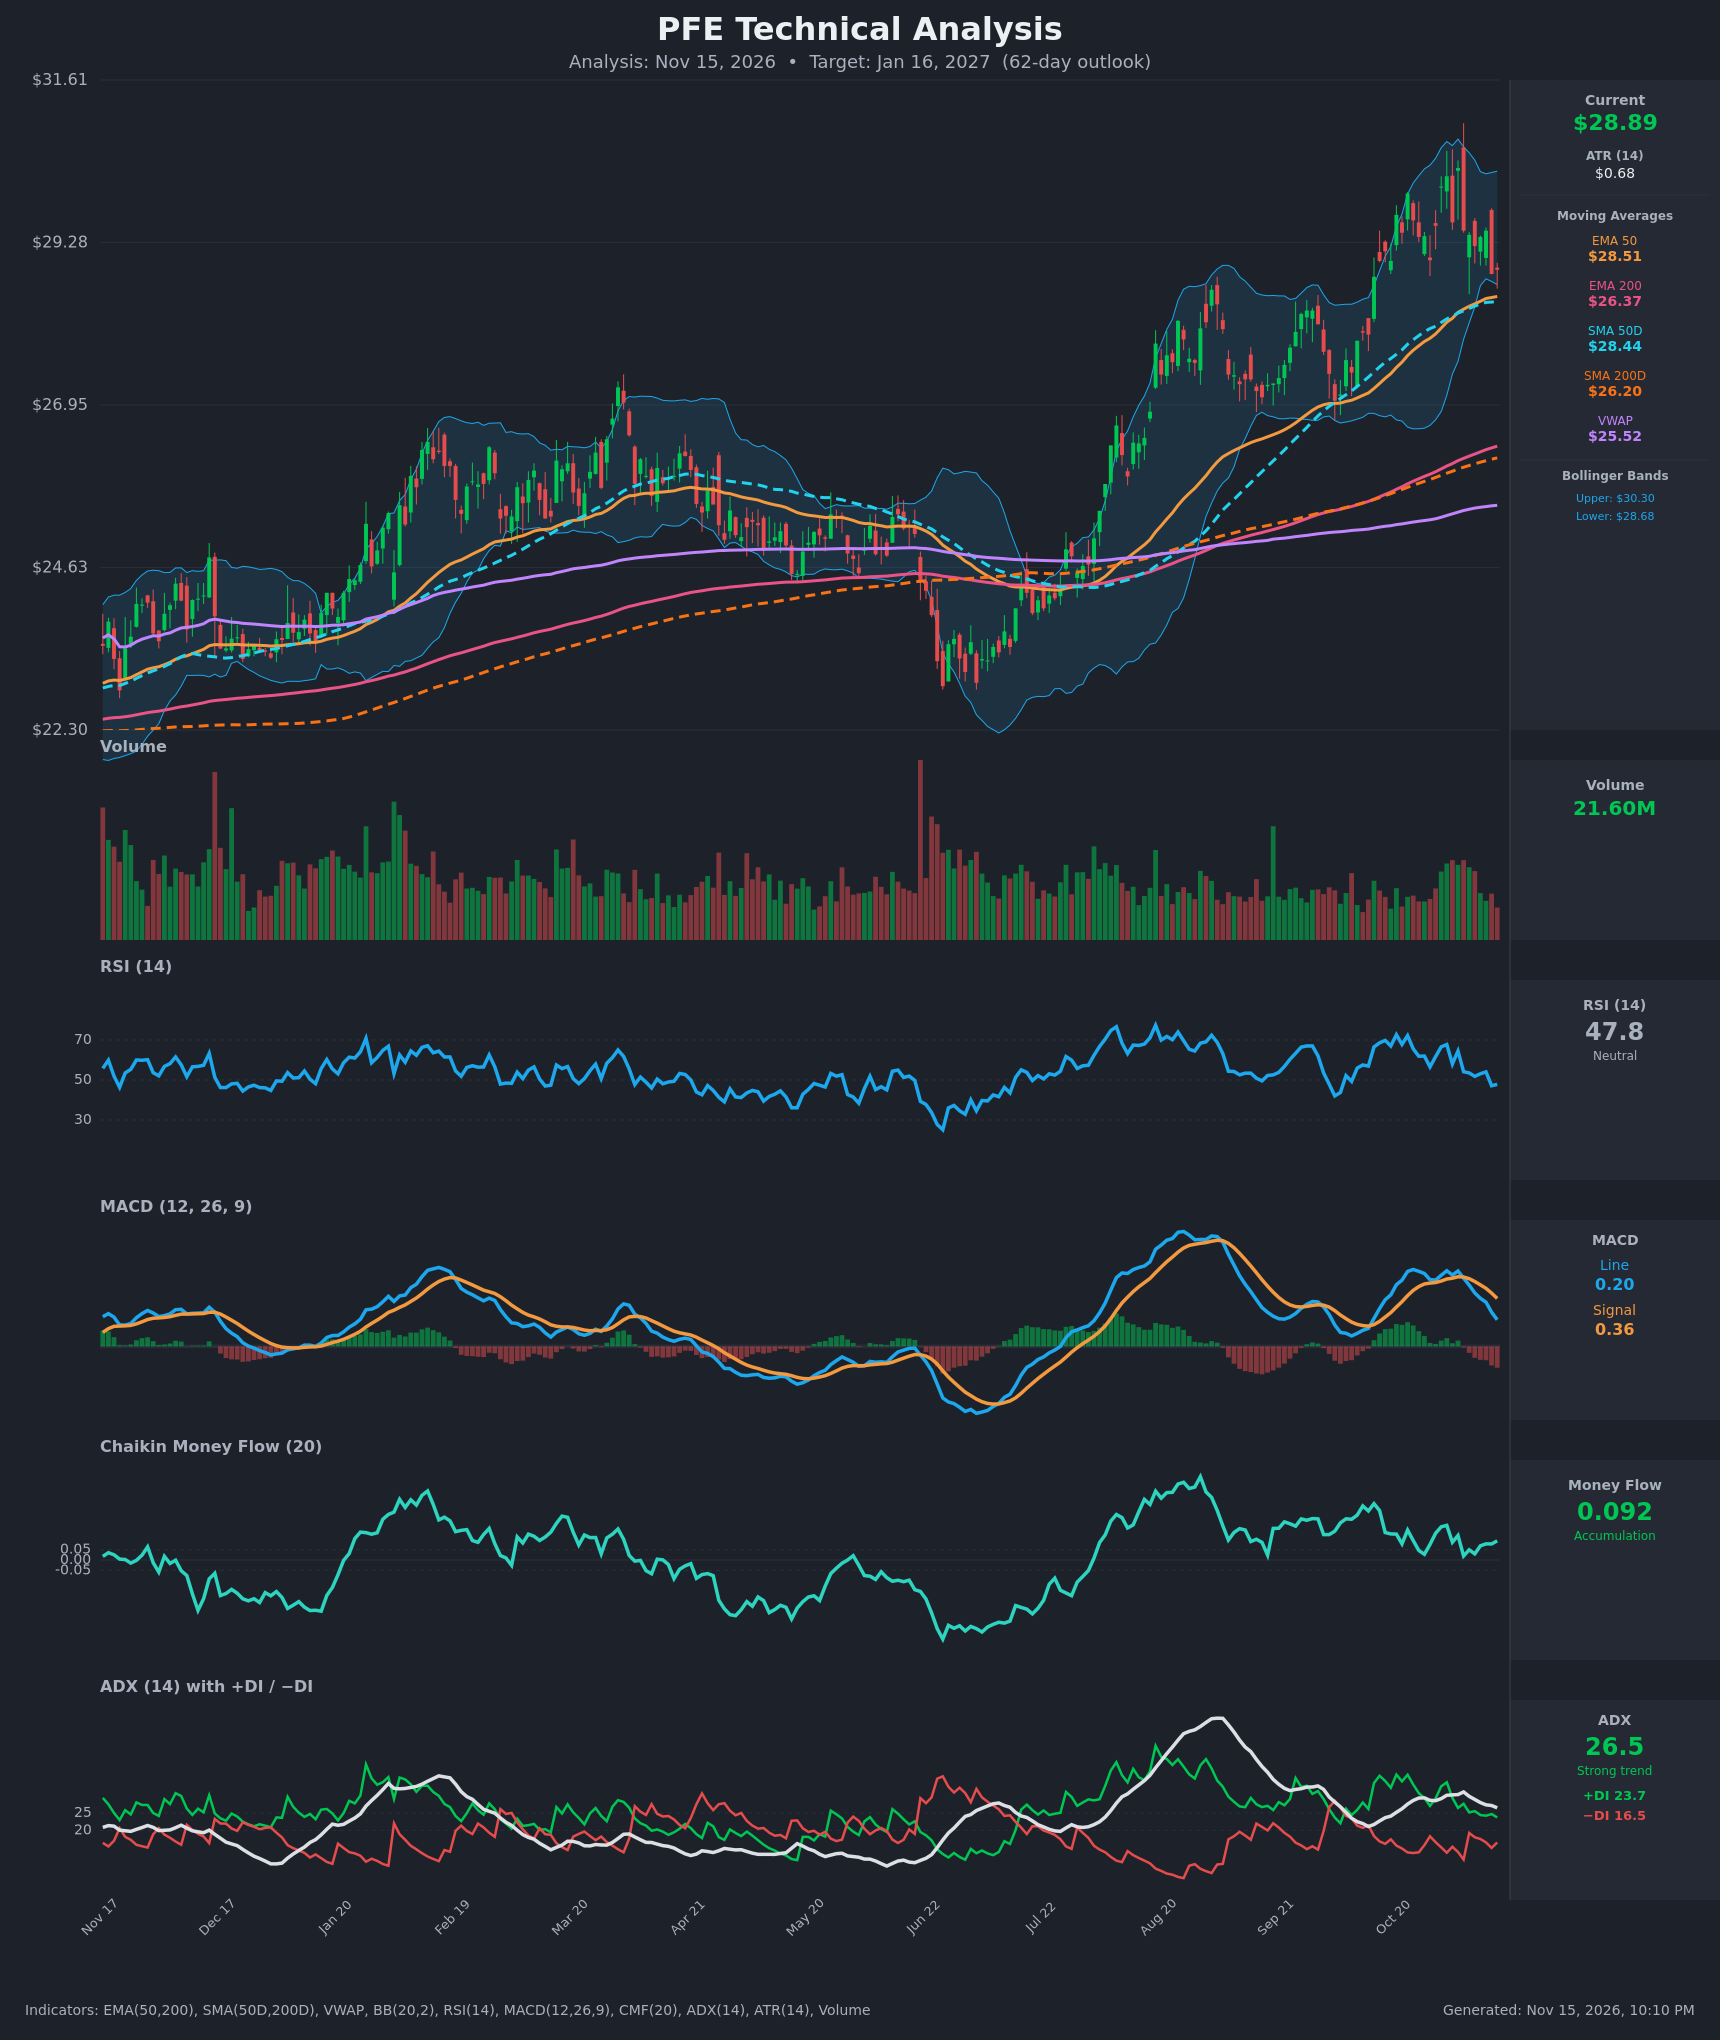
- RSI (14): 47.83, just under the 50 midline. It has dropped from 67.7 on Nov 2 to 47.1-47.8 over the last two sessions. Momentum is fading but not oversold, so there is room to fall further before a bounce signal appears. [Neutral]
- 20 EMA: The 20 EMA value wasn't supplied. The Bollinger midline (20-period average) is about $29.49, so price at $28.89 sits below it, and that level now acts as near-term resistance. Price is still above the EMA 50 ($28.51), which is the nearest dynamic support. [Neutral]
- MACD: Line 0.20 is below signal 0.36, a bearish crossover that occurred around Nov 5-6. The histogram is negative and widening, and the line has fallen from 0.575 to 0.20. Short-term momentum is clearly down. [Bearish]
- Bollinger Bands (20): Upper $30.30, lower $28.68. Price sits just above the lower band after being rejected near the upper band ($30.35 on Nov 4). The bands are contracting. A lower-band test inside an uptrend can mark a pullback low, but a close below the band would signal continuation lower. [Neutral]
- CMF (20): 0.092, above +0.05 and positive on most of the last 15 sessions (range 0.019-0.167). Buying pressure is still dominant despite the price dip, which suggests the pullback isn't being driven by heavy distribution. [Accumulation]
- ADX (14): 26.5 and easing from 31.0, with +DI 23.7 above −DI 16.5. The trend is still strong and bullish, but it is losing strength and the DI spread has narrowed from +17 to +7. [Strong Trend, Bullish but weakening]
- Volume: 21.60M, solid compared with the mid-year lows, but it is not expanding on the latest decline. The recent drop is not a high-volume breakdown. [Neutral to mildly supportive]
DIVERGENCES & TRENDS
- Trend structure: Price is above every major average: EMA 50 ($28.51), SMA 50D ($28.44), EMA 200 ($26.37), SMA 200D ($26.20) and VWAP ($25.52). The golden cross (SMA 50D above SMA 200D) is well established, and the EMA 50 is above the EMA 200. The long-term trend is clearly up.
- Short-term momentum: RSI, MACD and ADX are all rolling over, while price is still above its rising 50-day averages. This is a corrective pullback, not yet a trend reversal.
- Divergence: There is a mild bearish divergence. Price made a high of $30.35 on Nov 4 while the MACD line peaked lower (0.575 on Nov 2, 0.573 on Nov 4) than its earlier cycle peak (about 1.2 in August). This has been building for months.
- Money flow vs price: CMF remains positive while price falls, a mild bullish divergence that supports buyers defending the $28.4-28.5 area.
- Crossovers: A bearish MACD crossover has occurred. The price close below the Nov 9-11 consolidation range (about $29.2-29.45) is a short-term breakdown. There is no DI or moving-average crossover yet.
CHART PATTERNS
- Bearish Double Top / Triple Top (minor): Highs at about $30.08, $30.23 and $30.35 (Oct 30 - Nov 4) formed a resistance zone near $30.3. The neckline at roughly $29.2-29.4 was lost on Nov 12. The measured move (about $1.1 height) points to roughly $28.1-28.3, close to the SMA 50D/EMA 50 confluence. This is a legitimate near-term bearish risk.
- Larger context: The advance from the $23 area in June to $30+ forms a strong uptrend with higher lows. Pullbacks have found support at the 50-day averages (the Sep-Oct dip held there). The current dip is testing the same zone, which is consistent with a bullish flag or consolidation within the uptrend. A hold at $28.4 and a break above $29.5 would target a retest of $30.3 and then about $31.5.
- Significance: The minor top pattern argues for a test of $28.1-28.4. The larger trend favors a hold there and a resumption higher over 62 days.
POTENTIAL SCENARIOS
- Scenario 1: Bullish Pullback Holds, Trend Resumes — Price tests the $28.4-28.5 confluence (EMA 50/SMA 50D), holds, and rebuilds above the Bollinger midline on persistent CMF accumulation. Trigger: Daily close above $29.50 with MACD turning back up. Target: $30.30 first, then $31.00-31.60. Invalidation: Daily close below $28.00. (50% probability)
- Scenario 2: Bearish Double-Top Breakdown — The neckline break carries through, price loses the 50-day averages and falls toward the rising 200-day averages. Trigger: Close below $28.40 on expanding volume with RSI under 40. Target: $27.00, then $26.30-26.40 (EMA/SMA 200). Invalidation: Reclaim of $29.50. (30% probability)
- Scenario 3: Neutral Range Consolidation — Price chops between $28.4 and $30.3 as ADX fades below 20. Trigger: Failure to break either $28.4 or $30.3. Target: $28.50-$30.00. Invalidation: Close outside the range on volume. (20% probability)
PRICE TARGETS
- Target Price: $30.00 (62-day, Jan 16, 2027)
- Expected Range: $26.00 to $32.00 (width $6.00, about 20.8% of current price, consistent with the 18-30% guidance for 61-180 days)
- Key Levels: Support at $28.44 (SMA 50D / EMA 50 zone), Resistance at $30.35 (recent double/triple-top highs)
OVERALL BIAS
OVERALL BIAS: BULLISH - The long-term structure is intact: price is above all major averages, the golden cross is in place, CMF shows accumulation, and +DI leads −DI with ADX above 25. The short-term pullback (bearish MACD, minor double-top breakdown) is likely to find support near $28.4, but conviction is modest because momentum is weakening.
This is educational analysis and not financial advice.