PFE 83-day bullish forecast — Nov 15, 2026
- Bias: Bullish
- Timeframe: 83 days (made Nov 15, 2026, target date Feb 5, 2027)
- Price at analysis: $28.89
- Price target: $29.70
- Expected range: $26.50 – $32.00
- Result: Pending — graded after the close on Feb 5, 2027
Get a free AI analysis of PFE today
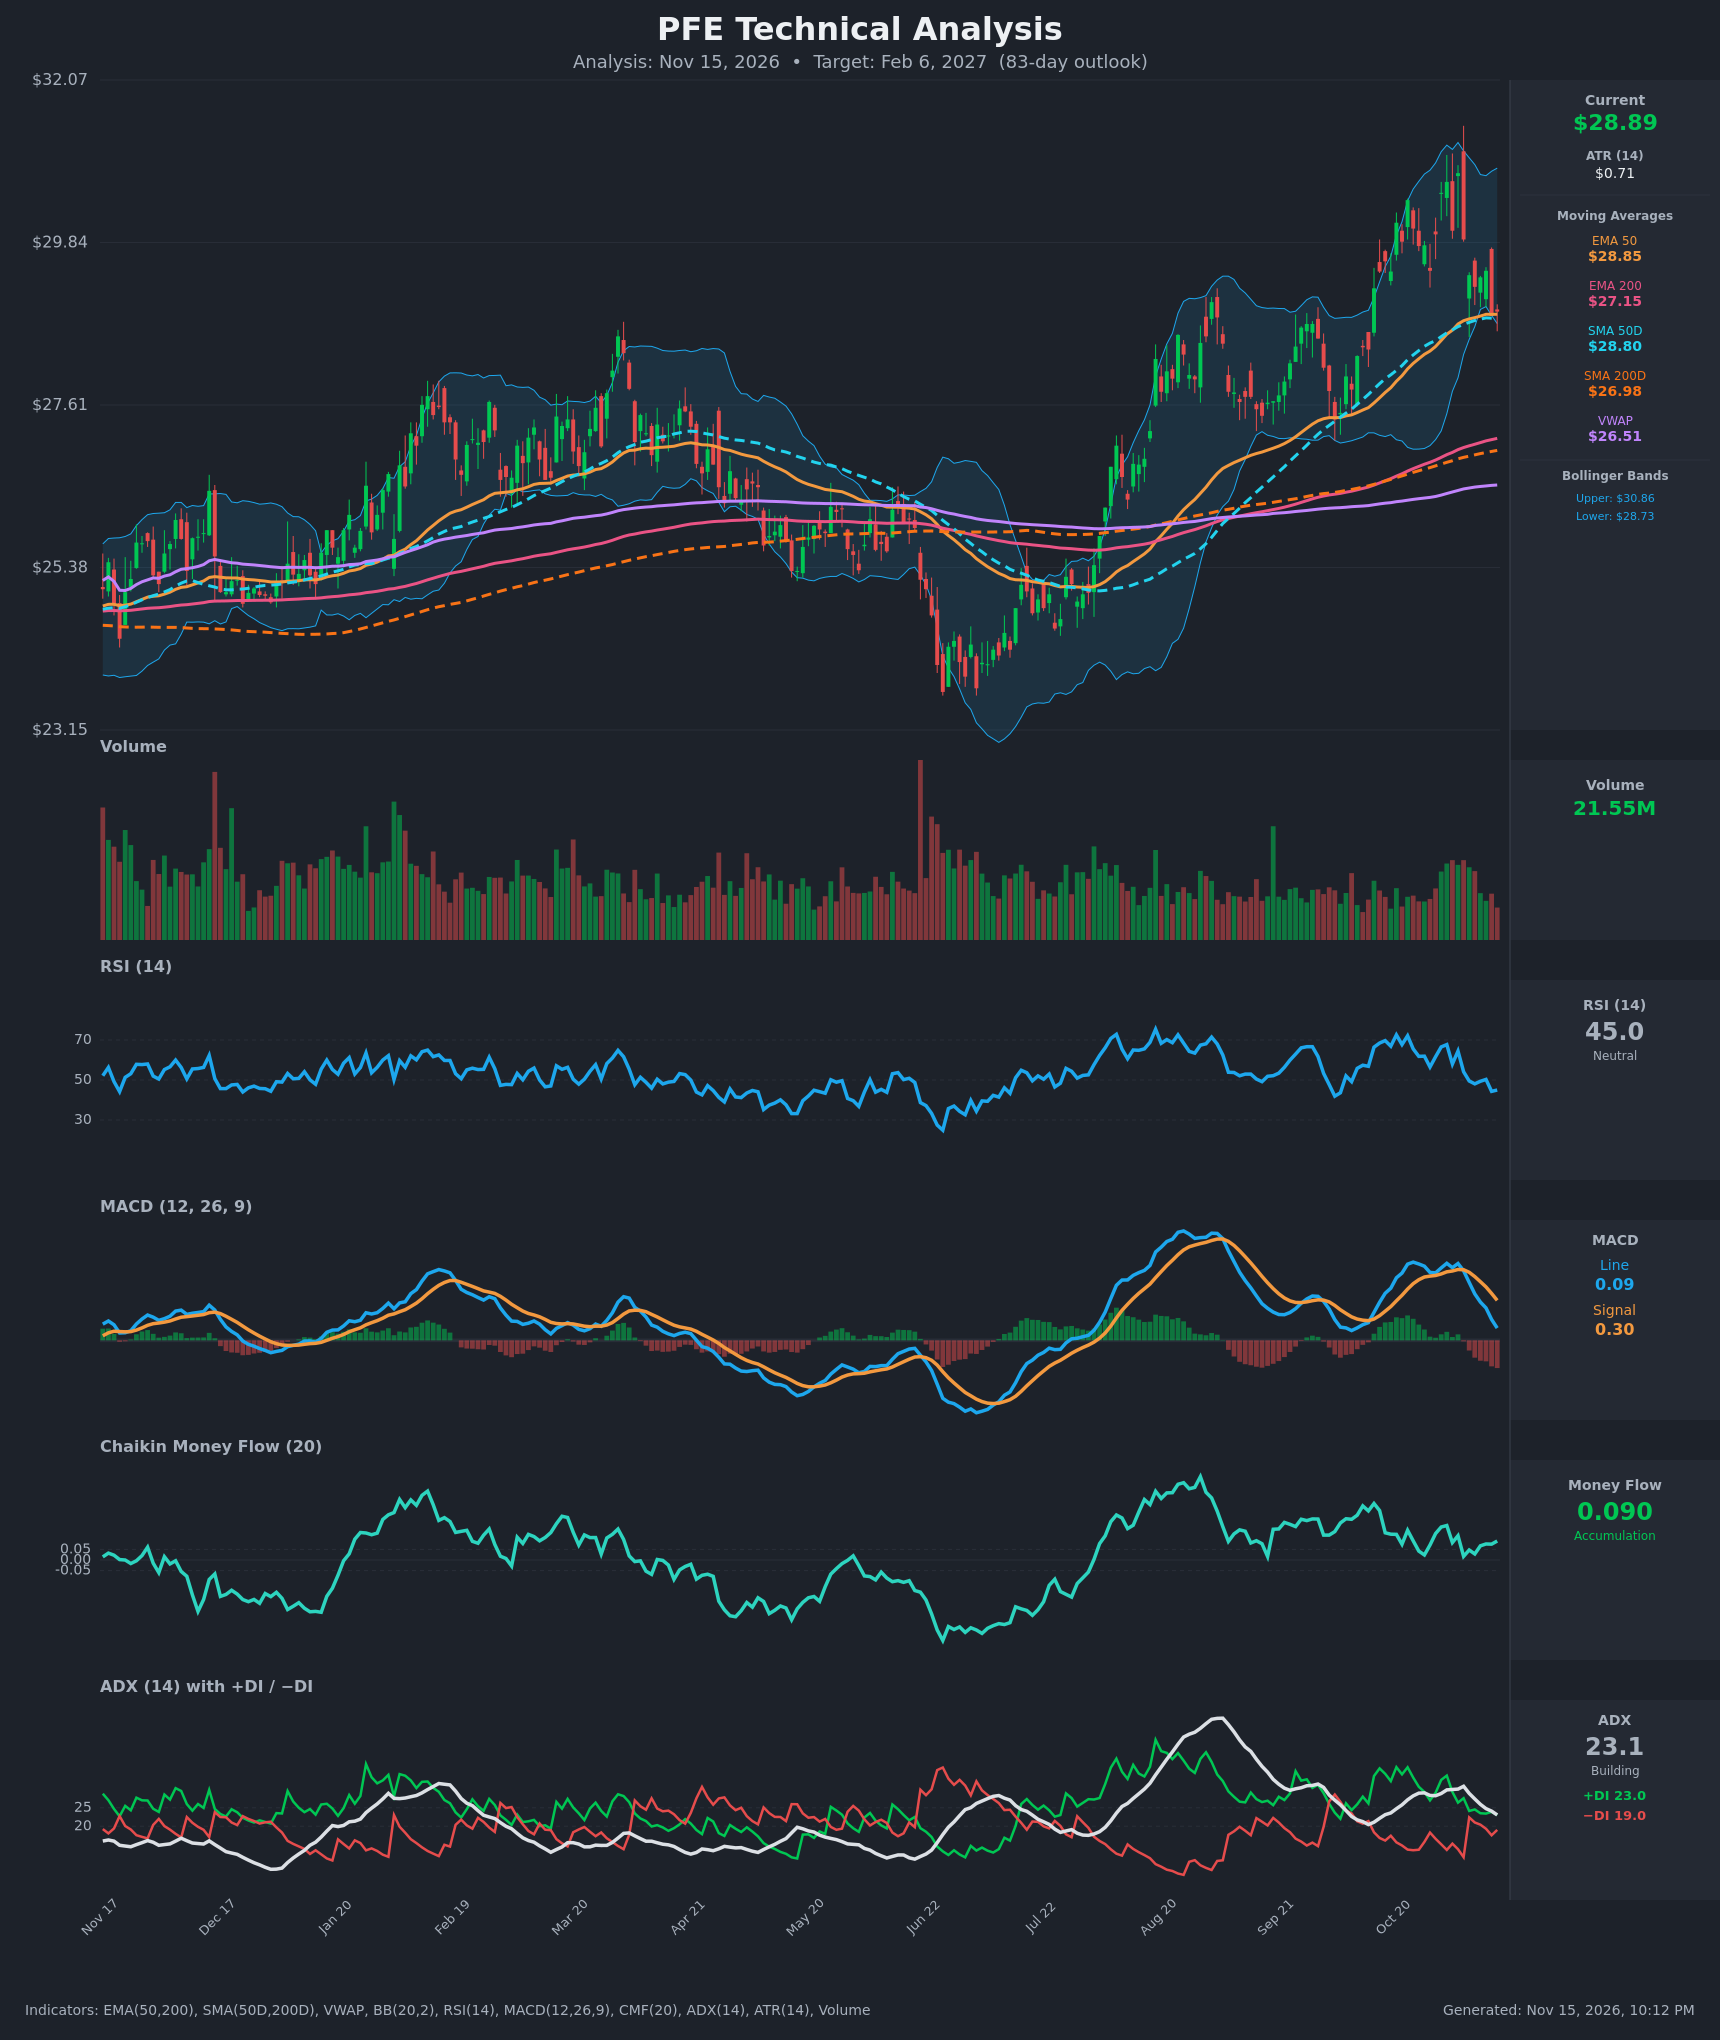
Analysis
TECHNICAL INDICATORS
- RSI (14): 44.99, down from 67.7 on Nov 2 and just below the 50 midline. Momentum has cooled sharply from the recent push toward overbought, but it is nowhere near oversold (30). [Neutral]
- 20 EMA: The 20 EMA isn't supplied, so I use the EMA 50 at $28.85 as the nearest dynamic reference. Price ($28.89) sits right on it, along with the SMA50D at $28.80. This is a live support test, and EMA 200 ($27.15) is the next floor. [Neutral]
- MACD: Line 0.093 is below Signal 0.302, a bearish crossover that occurred around Nov 5-6. The histogram is negative and still widening, and the line has fallen from 0.58 to 0.09 and is approaching zero. Short-term momentum is bearish. [Bearish]
- Bollinger Bands (20): Upper $30.86, lower $28.73. Price at $28.89 is hugging the lower band after a roughly 2-ATR drop from the $30.79 high. The band is wide, so volatility is elevated. Being at the lower band in an uptrend often leads to a bounce, but a close below $28.73 would be a bearish expansion. [Neutral]
- CMF (20): 0.090 is above the +0.05 threshold and has stayed positive through the whole pullback (0.017 to 0.164). Buyers are still absorbing supply on the dip. [Accumulation]
- ADX (14): 23.1, falling from 30.8, so the prior trend is losing strength. +DI (23.0) is just above −DI (19.0), though the gap has narrowed sharply from 33.7 vs 13.6. Bulls retain a slim edge. [Weak Trend + marginally bullish]
- Volume: 21.55M, moderate and in line with recent averages. The red candles in the last few sessions came on decent volume but with no capitulation spike. The drop is orderly rather than a panic exit. [Neutral to mildly bearish]
DIVERGENCES & TRENDS
- Moving averages: The long-term structure is bullish. Price is above the SMA200D ($26.98), EMA200 ($27.15) and VWAP ($26.51). EMA50 > EMA200 and SMA50D > SMA200D, so the golden cross is in place. The 50-period averages are still rising but flattening ($28.85 and $28.80), and price is now hugging them.
- Momentum: MACD and RSI have both rolled over from a peak near Nov 2-4, so short-term momentum is fading. Price made a high of $30.79 on Nov 4 while RSI was 64.5, below its prior 67.7 peak. That is a minor bearish divergence that has since played out.
- Money flow vs. price: CMF stayed positive during a roughly 6% pullback. This is a mild bullish divergence, since sellers are not dominating.
- Trend strength: ADX has dropped from above 30 to 23, and the DI spread has compressed. The September-October trend is fading into consolidation.
- Crossovers: There was a bearish MACD crossover around Nov 5-6, and no DI crossover yet. The next one to watch is −DI crossing above +DI. There is no EMA or SMA death cross.
CHART PATTERNS
- Bearish Triple/Double Top (near term): Highs at roughly $30.5-$30.8 (Oct 30, Nov 2, Nov 4) with a neckline near $29.2-$29.4. Price has now closed below the neckline at $28.83-$28.89. The measured move (~$1.5) points to about $27.80, close to the EMA200 area. This is a risk to the bullish case.
- Larger structure: After the base near $24 in June, price made a strong higher-low advance from $24 to $30.8, confirming a long-term uptrend. The current action looks like a pullback or consolidation into the rising 50-period MAs, a continuation-style Bullish Flag or Pennant. A hold at $28.7-$28.8 and a rebound would keep that alive, with a breakout above $30.8 targeting about $32.
- Takeaway: The pattern evidence is split. The top pattern is bearish near term, and the broader uptrend with support confluence is bullish.
POTENTIAL SCENARIOS
- Scenario 1: Bullish Support Hold and Trend Resumption — Price defends the $28.70-$28.85 confluence (lower BB, EMA50, SMA50D). Accumulation continues, MACD resets near zero and turns back up, and price retests the highs. Trigger: a daily close back above $29.45 and a MACD bullish crossover. Target: $30.80, with an extension to $31.50-$32.00. Invalidation: a sustained close below $28.00. (45% probability)
- Scenario 2: Bearish Triple-Top Breakdown — The neckline break extends. The MACD bearish crossover and weakening ADX lead to a drop toward the rising long-term averages. Trigger: a close below $28.70 (the lower BB and SMA50D). Target: $27.80, then the EMA200/SMA200D zone at $27.00-$27.15. Invalidation: a reclaim of $29.50 on rising volume. (35% probability)
- Scenario 3: Neutral Range Consolidation — Price chops between the 50-period MAs and the $30.0 area as ADX stays below 25. Trigger: ADX falling toward 20 with flat MACD. Target: $28.50-$30.00. Invalidation: a decisive close outside $27.80-$30.80. (20% probability)
PRICE TARGETS
- Target Price: $29.70 (83-day horizon)
- Expected Range: $26.50 to $32.00. The width is $5.50, or about 19% of the current price, consistent with the 61-180 day guidance.
- Key Levels: Support at $28.80 (SMA50D/EMA50 confluence, with the lower BB at $28.73 just below). Resistance at $30.80 (the November swing high and upper BB).
OVERALL BIAS
OVERALL BIAS: BULLISH - Conviction is modest. The long-term uptrend is intact (price above the rising 200-period averages with a golden cross in place), CMF shows accumulation through the dip, and price is at a confluence of support. The short-term bearish MACD crossover and the broken triple-top neckline are the main risks to this call.
This is educational analysis and not financial advice.