NIO 27-day bearish forecast — Nov 15, 2026
- Bias: Bearish
- Timeframe: 27 days (made Nov 15, 2026, target date Dec 11, 2026)
- Price at analysis: $2.90
- Price target: $2.72
- Expected range: $2.48 – $2.98
- Result: Pending — graded after the close on Dec 11, 2026
Get a free AI analysis of NIO today
Analysis
TECHNICAL INDICATORS
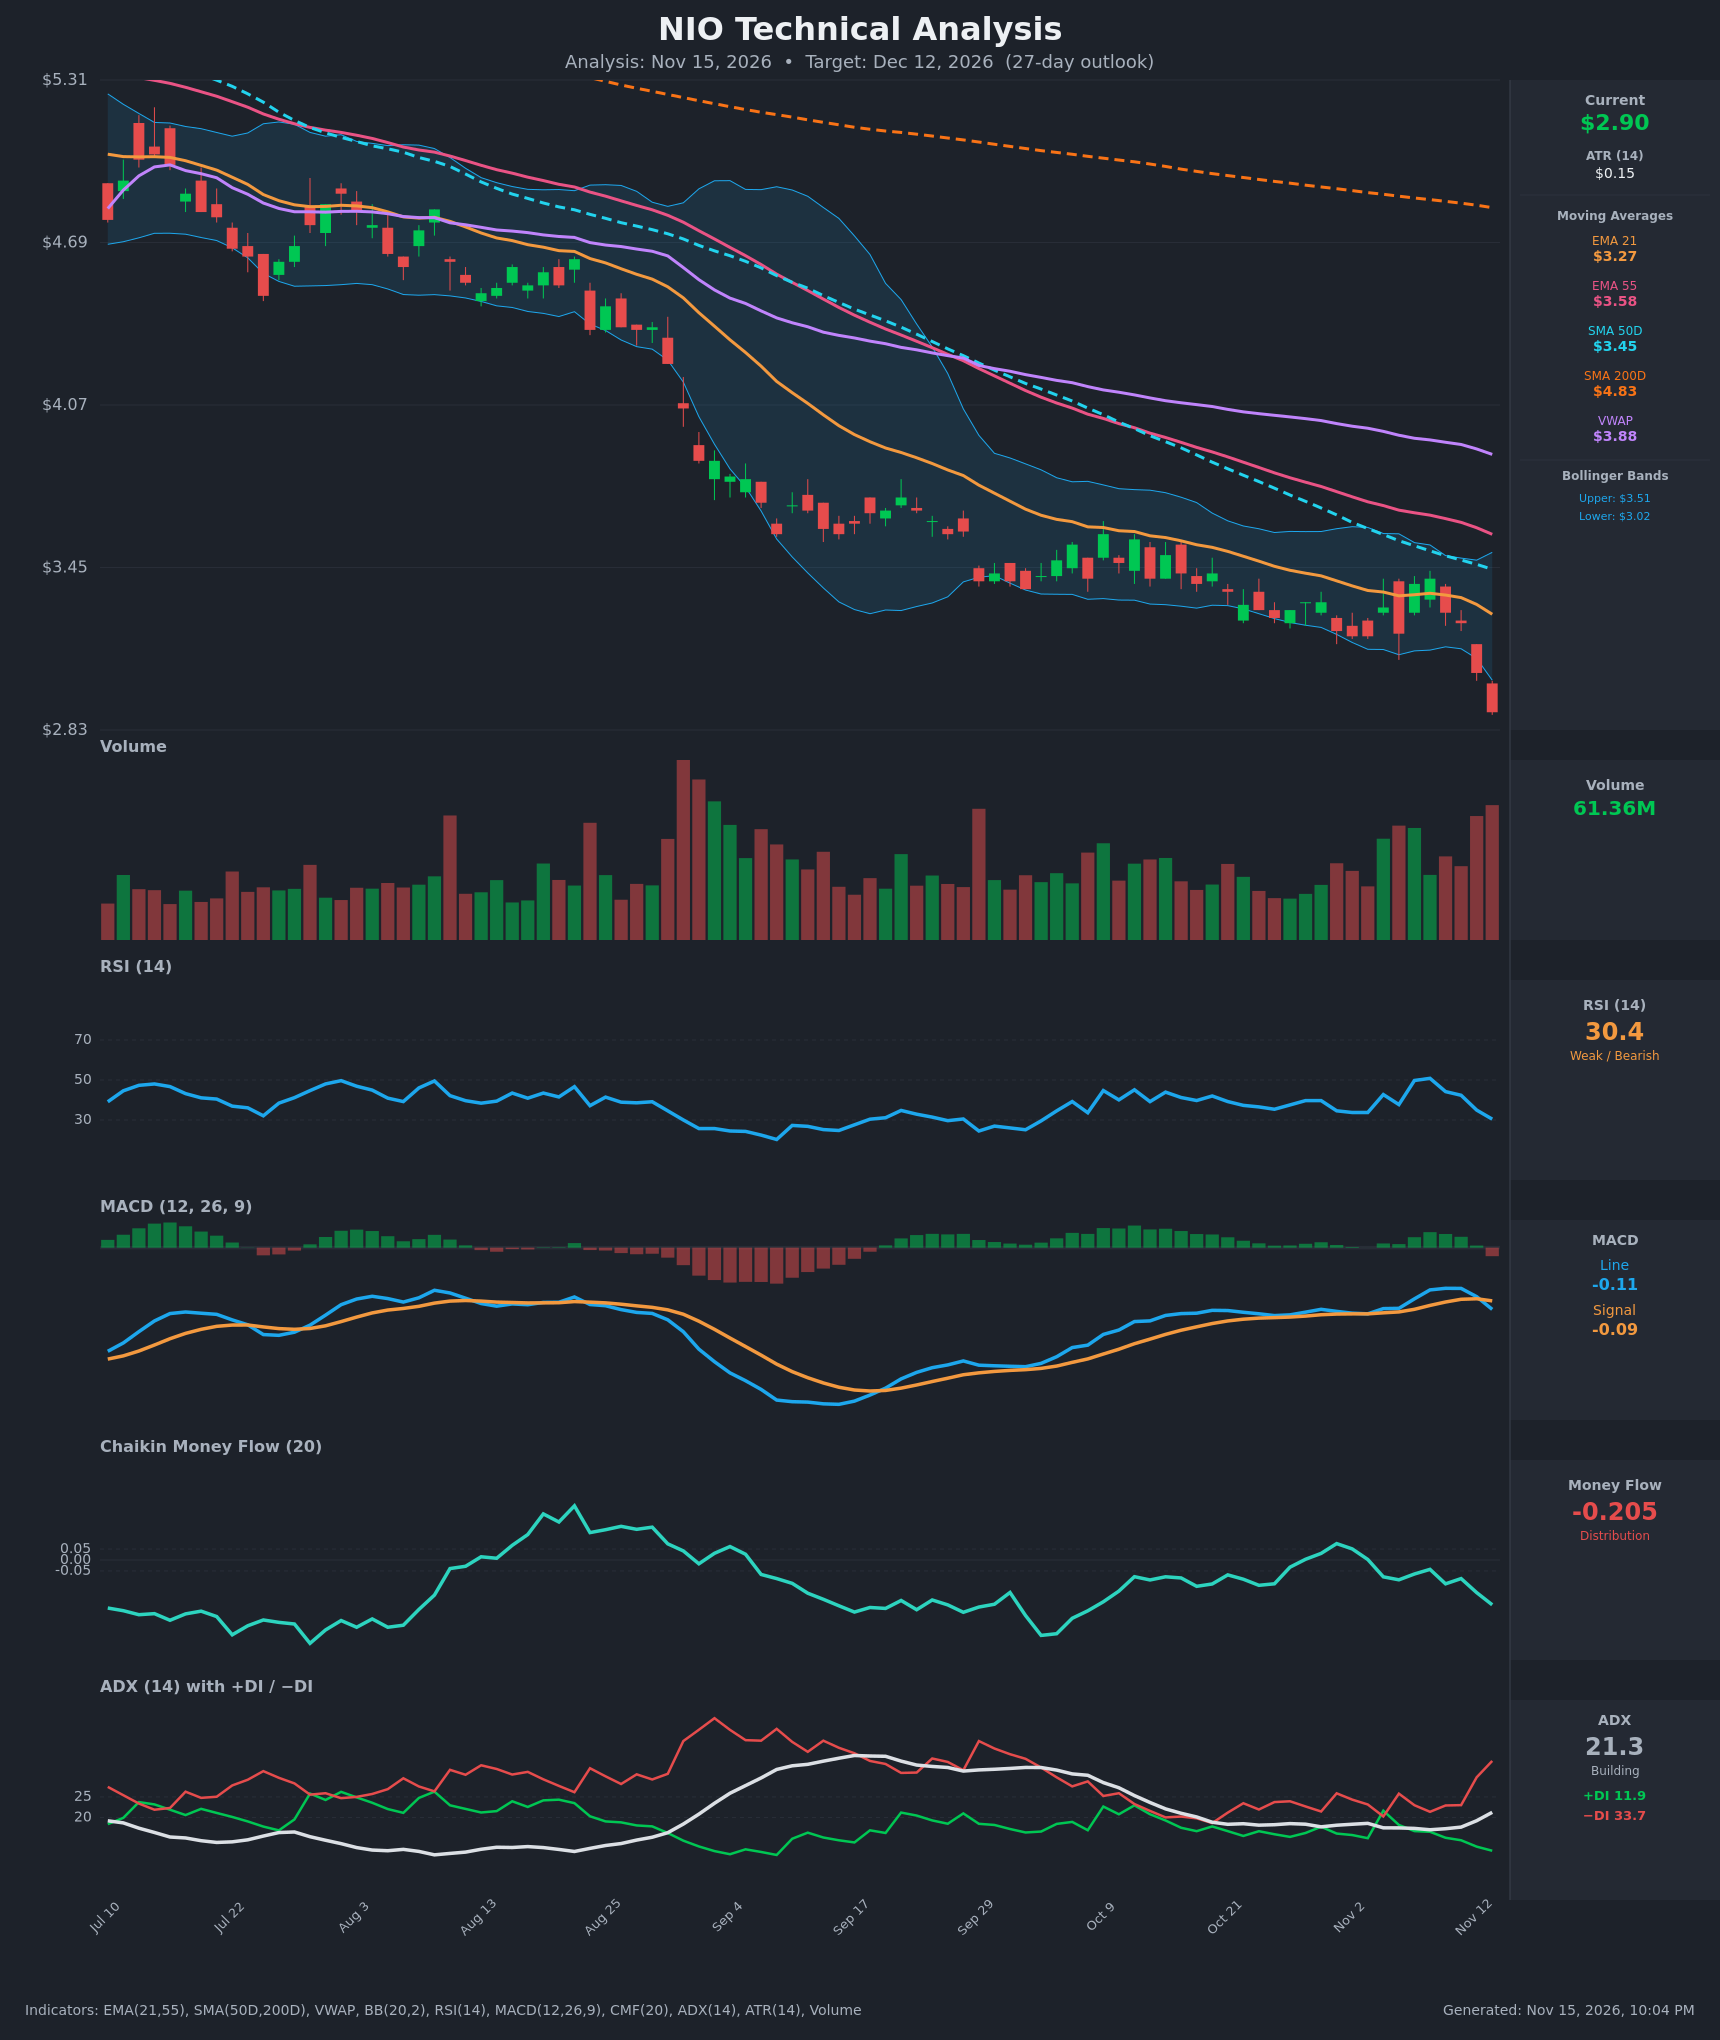
- RSI (14): 30.43, right at the oversold threshold and falling sharply from ~50 on Nov 6-9. Momentum is clearly down. Oversold can stay oversold in a strong downtrend, and the chart shows RSI bottoming near 25 in September before a muted bounce. [Bearish]
- 20 EMA: The supplied value is the EMA 21 at $3.27, with the EMA 55 at $3.58. Price at $2.90 is about 11% below the EMA 21, which acts as resistance. The EMA 21 has been below the EMA 55 throughout, a persistent bearish stack. [Bearish]
- MACD: Line -0.1084 is below Signal -0.0935, and the histogram has just turned negative (about -0.015). A fresh bearish crossover occurred on Nov 12-13 after a failed attempt to cross up. Both lines are below zero. [Bearish]
- Bollinger Bands (20): Price at $2.90 is below the lower band ($3.02) and far below the upper band ($3.51). The bands are drifting lower and price has been riding the lower band, so this is a "band walk". A close outside the band signals strong downside momentum, though it also raises odds of a short-term mean-reversion bounce toward the $3.27 midline. [Bearish]
- CMF (20): -0.205, well below -0.05 and falling steadily from roughly 0 on Nov 3. This is clear distribution and selling pressure. [Distribution]
- ADX (14): 21.3 and rising (from 17.4 on Nov 6), with -DI at 33.7 far above +DI at 11.9. The trend is just emerging from a weak phase, and bears have firm control. [Strengthening Trend – Bearish]
- Volume: 61.36M, among the heaviest bars of the last several weeks, on a red breakdown candle. Heavy volume on a downside break confirms selling conviction, though it could also hint at late-stage capitulation. [Bearish – confirms breakdown]
DIVERGENCES & TRENDS
- No bullish divergence yet. Price made a new low at $2.90, and RSI (30.4), MACD and CMF all made lower lows alongside it. The indicators confirm price.
- Moving average structure: Price is below the EMA 21, EMA 55, SMA 50D ($3.45), SMA 200D ($4.83) and VWAP ($3.88). The SMA 50D is far below the SMA 200D, so the death cross is long established. This is a firm long-term downtrend.
- MACD: The bounce toward a bullish cross on Nov 6-9 failed, and the bearish crossover on Nov 13 is a fresh sell signal.
- ADX/DI: -DI jumped from 23 to 33.7 in two sessions while +DI collapsed to 11.9. Sellers are accelerating.
- Breakdown: Price fell out of the $3.20-$3.40 consolidation range on Nov 12-13 (closes of $3.05 and $2.90), with CMF dropping from -0.085 to -0.205.
CHART PATTERNS
- Bearish Flag / Rectangle Continuation (breakdown): After the sharp decline in August-September, price consolidated in a narrow, slightly downward-sloping channel at roughly $3.20-$3.60 from mid-September to early November. It has now broken to the downside, consistent with the "Bearish Flag/Pennant" continuation setup. The measured-move target from the breakdown (~$3.20) minus the pole (~$0.8-0.9) points toward $2.35-$2.45. That is the extended target and unlikely to be reached fully within 27 days.
- Counter-pattern: The long series of lower highs and lower lows could be read as a falling wedge or descending channel (bullish reversal). There is no confirmed upside break above the descending upper trendline (~$3.30-$3.40), so it remains only a potential bounce setup.
- Significance: The breakdown is confirmed by volume and indicators, so continuation lower is favored, with oversold bounces likely along the way.
POTENTIAL SCENARIOS
- Scenario 1: Bearish Continuation Lower — The breakdown from the $3.20 consolidation continues, with -DI dominant, CMF in distribution and price walking the lower Bollinger Band. Rallies get sold near the $3.02-$3.27 area. Trigger: daily close below $2.83 (recent low) with continued heavy volume. Target: $2.70, with extension to $2.50. Invalidation: daily close back above $3.27 (EMA 21). (55% probability)
- Scenario 2: Bullish Oversold Bounce — RSI around 30 and a close below the lower band set up a mean-reversion rally toward the middle band and EMA 21, but it fails below the EMA 55. Trigger: reclaim of $3.02 (lower band) on a daily close, with RSI turning up above 35. Target: $3.25-$3.30. Invalidation: close below $2.80. (33% probability)
- Scenario 3: Neutral Base Building — Price stabilizes between $2.80 and $3.10 as selling exhausts. Trigger: several sessions of narrow range with falling volume and CMF flattening. Target: $2.95. Invalidation: close outside the $2.75-$3.15 range. (12% probability)
PRICE TARGETS
- Target Price: $2.72 (27-day horizon, Dec 12, 2026)
- Expected Range: $2.48 to $2.98. Width is $0.50, or about 17% of the current price, consistent with the 30-60 day guidance, trimmed slightly for 27 days.
- Key Levels: Support at $2.70 (round-number and ATR-based downside), Resistance at $3.02 (lower Bollinger Band and prior breakdown area, with the EMA 21 at $3.27 above that)
OVERALL BIAS
OVERALL BIAS: BEARISH - Price is below every moving average and has broken below the lower Bollinger Band. MACD has crossed bearishly, -DI (33.7) dominates +DI (11.9) with ADX rising, CMF shows heavy distribution (-0.205), and the breakdown came on heavy volume. Oversold RSI (30.4) raises the odds of a bounce, but it favors a relief rally within the downtrend rather than a reversal.
This is educational analysis and not financial advice.