NIO 62-day bearish forecast — Nov 15, 2026
- Bias: Bearish
- Timeframe: 62 days (made Nov 15, 2026, target date Jan 15, 2027)
- Price at analysis: $2.90
- Price target: $2.60
- Expected range: $2.35 – $3.20
- Result: Pending — graded after the close on Jan 15, 2027
Get a free AI analysis of NIO today
Analysis
TECHNICAL INDICATORS
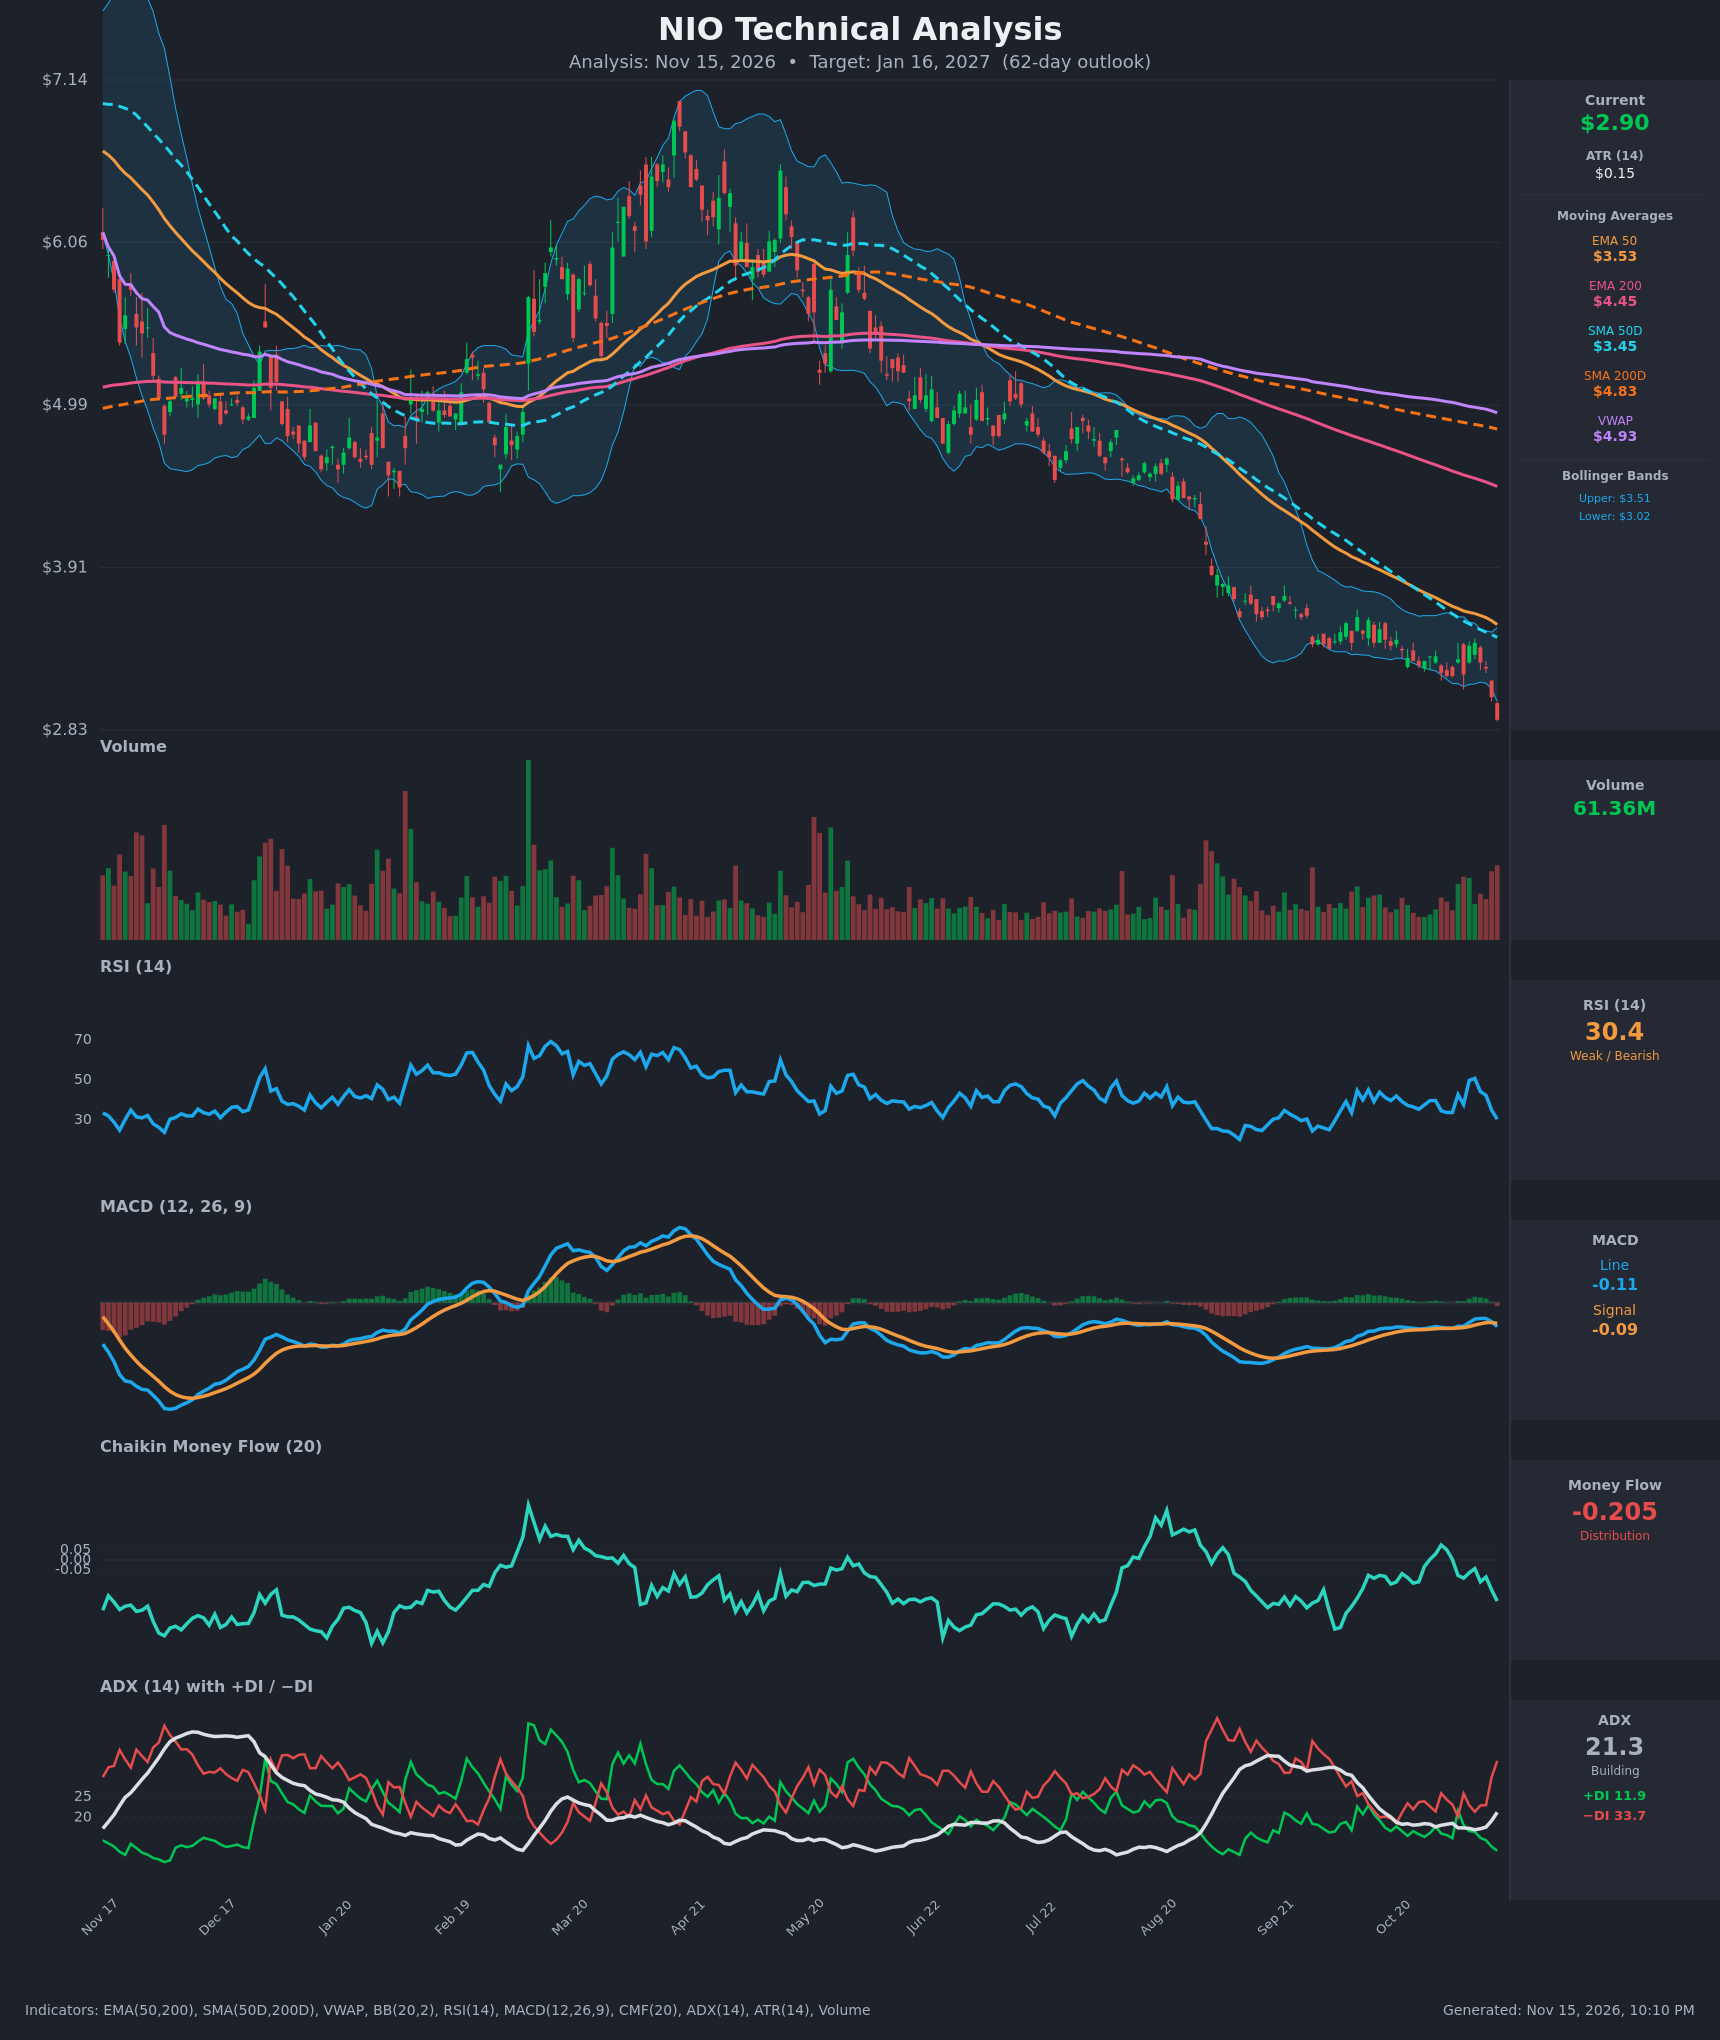
- RSI (14): 30.43, right at the oversold threshold. It fell from about 50 on Nov 9 to 30 in four sessions, so momentum is sharply down. There is no bullish turn yet, and oversold readings can persist in a strong downtrend. [Bearish]
- 20 EMA: The 20 EMA isn't given, but the 20-period Bollinger midline is about $3.27. Price at $2.90 is well below it, which makes that level near-term resistance. EMA50 ($3.53) and EMA200 ($4.45) are stacked above price in a bearish order. [Bearish]
- MACD: The MACD line (-0.108) crossed back below the signal (-0.093) on Nov 13. It is negative, and the histogram has flipped negative again after a brief improvement. [Bearish]
- Bollinger Bands (20): Upper $3.51, lower $3.02. Price at $2.90 closed below the lower band, a breakdown to a new low. This is an extension in a downtrend with a band walk, not a reversal signal. A short-term snap-back toward the $3.27 midline is possible. [Bearish]
- CMF (20): -0.205, a clear distribution reading. It fell from -0.04 to -0.205 in the last few sessions as price broke down. [Distribution]
- ADX (14): 21.3 and rising from 17. −DI (33.7) is far above +DI (11.9), so bears are in control. ADX is just below the 25 trend threshold, but the DI spread shows a trend that is strengthening to the downside. [Weak-but-building Trend, Bearish]
- Volume: 61.36M, with recent volume bars rising and red on the breakdown days. Expanding volume on a break to new lows confirms the selling. [Bearish confirmation]
DIVERGENCES & TRENDS
- No bullish divergence: RSI (30.4) is not making higher lows against price. The earlier Aug–Sep low had RSI near 25. The current price low has RSI higher at 30, but it is still falling, so it is not yet a confirmed divergence.
- Death cross in place: SMA50D ($3.45) is below SMA200D ($4.83), and EMA50 ($3.53) is below EMA200 ($4.45). Both gaps are widening, a long-term downtrend signature.
- Price vs VWAP: Price is far below VWAP ($4.93), which signals persistent seller dominance.
- MACD: The recent bullish cross (Nov 6–9) failed, and the line has rolled over beneath the signal.
- Breakdown: Price lost the $3.05 to $3.20 consolidation shelf on Nov 12–13 and closed below the lower Bollinger Band.
- DI: −DI jumped from 23 to 33.7 in three sessions, a fresh bearish acceleration.
CHART PATTERNS
- Bearish Flag / Pennant: Price dropped in August, then drifted sideways in a tight, slightly downward-sloping range from about $3.20 to $3.60 through September–early November. The break below $3.05–$3.20 resembles a continuation breakdown. The measured move from the August drop (roughly $4.40 to $3.50, about $0.90) projected from the break near $3.15 points to about $2.25–$2.50, though that is an extreme target for 62 days.
- Long-term trend: A lower-high, lower-low structure since the April peak near $7, with no reversal pattern (double bottom or inverse H&S) forming.
- Caveat: The oversold RSI and the close below the lower band mean a relief bounce toward $3.15–$3.30 is likely along the way.
POTENTIAL SCENARIOS
- Scenario 1: Bearish Continuation Breakdown — Price keeps trending lower after the break of the multi-month consolidation, with −DI dominant, CMF negative and all moving averages overhead. Trigger: sustained closes below $2.85 and failure to reclaim $3.05. Target: $2.40–$2.60 by mid-January. Invalidation: daily close above $3.30 (the Bollinger midline and prior support-turned-resistance). (50% probability)
- Scenario 2: Neutral Base and Range — Oversold conditions lead to stabilization, with price chopping between about $2.60 and $3.20 as selling exhausts. Trigger: RSI holds above 30 and volume dries up. Target: $2.70–$3.10. Invalidation: close below $2.55 or above $3.30. (30% probability)
- Scenario 3: Bullish Oversold Reversal — A sharp mean-reversion rally from oversold, with RSI divergence and a MACD bullish cross. Trigger: reclaim of $3.15 on rising volume. Target: $3.50–$3.65 (EMA50/SMA50D). Invalidation: failure at $3.30 and a new low below $2.80. (20% probability)
PRICE TARGETS
For the 62-day horizon (to about Jan 16, 2027), the range width should be about 18–30% of the current price. The Expected Range is $2.35 to $3.20, a width of $0.85, or 29.3% of $2.90, which fits the guidance. The target of $2.60 sits about 10% below the current price, which is consistent with a bearish bias and about 2 ATR-weeks of downside drift.
- Target Price: $2.60 (for the 62-day timeframe)
- Expected Range: $2.35 to $3.20
- Key Levels: Support at $2.60, Resistance at $3.27
OVERALL BIAS
OVERALL BIAS: BEARISH - Price broke below the multi-month consolidation and closed under the lower Bollinger Band. A death cross is in place, −DI (33.7) dominates +DI (11.9), CMF is at -0.205, MACD is back below its signal, and every key moving average sits overhead as resistance. Oversold RSI argues for a bounce along the way, but the evidence favors lower prices over 62 days.
This is educational analysis and not financial advice.