NIO 83-day bearish forecast — Nov 15, 2026
- Bias: Bearish
- Timeframe: 83 days (made Nov 15, 2026, target date Feb 5, 2027)
- Price at analysis: $2.90
- Price target: $2.65
- Expected range: $2.20 – $3.10
- Result: Pending — graded after the close on Feb 5, 2027
Get a free AI analysis of NIO today
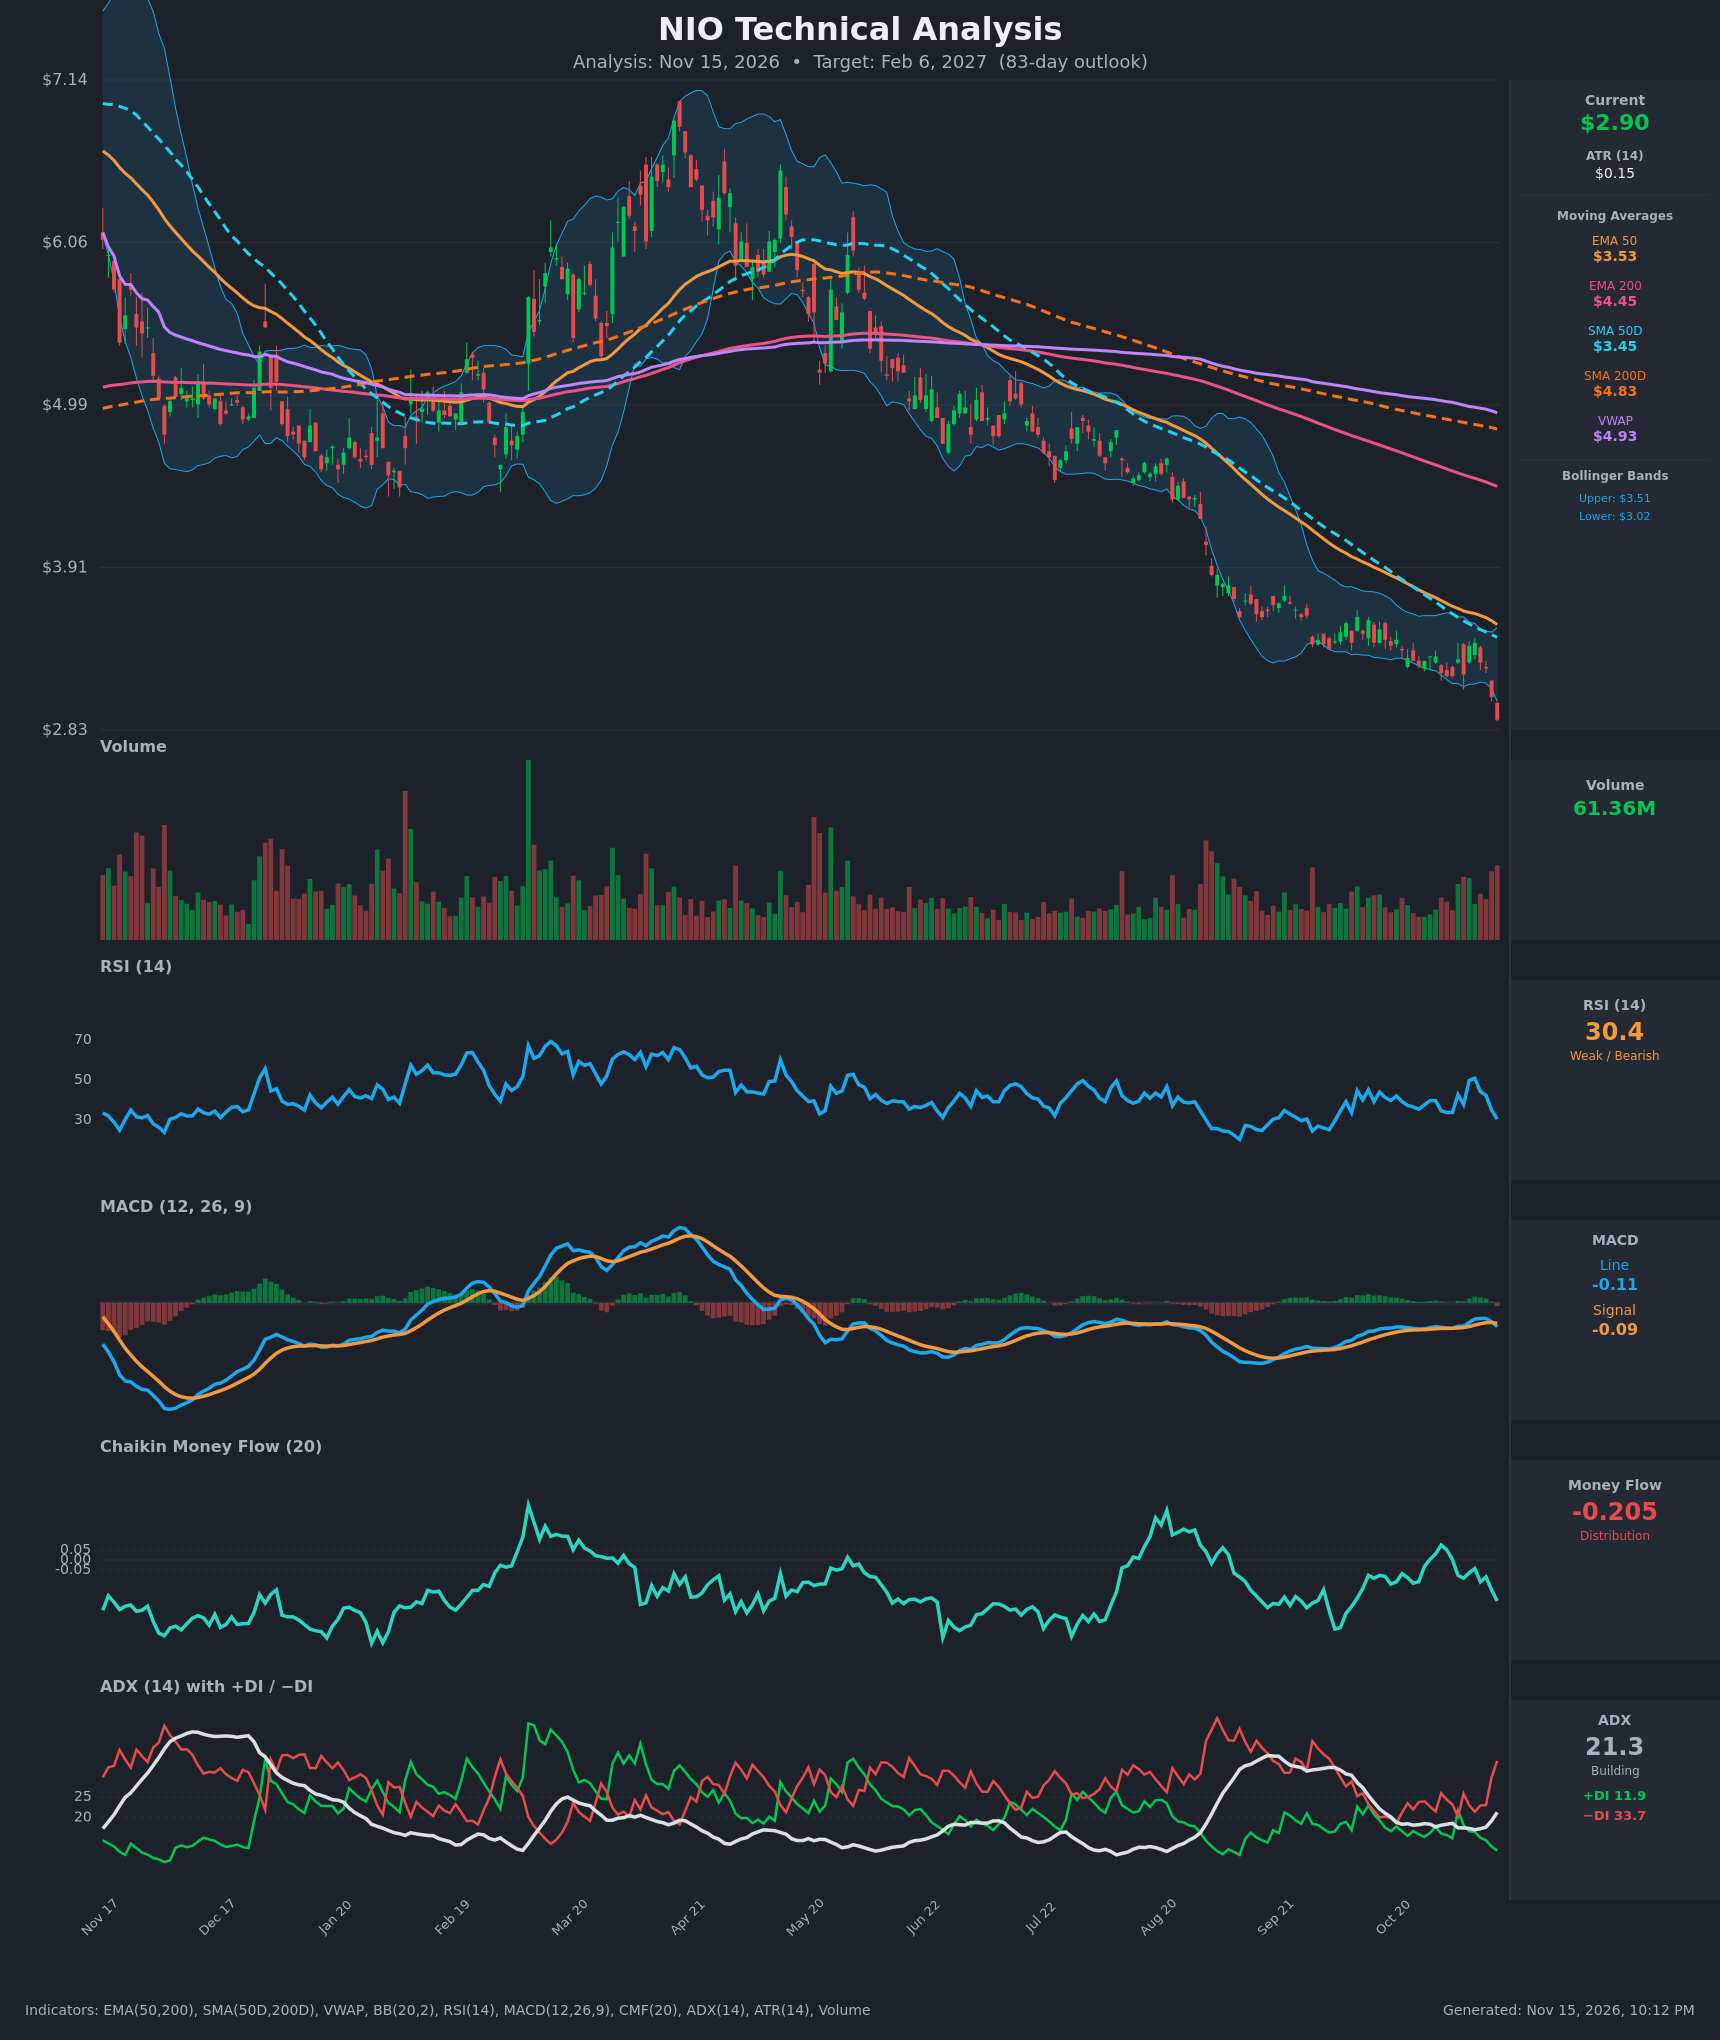
Analysis
TECHNICAL INDICATORS
- RSI (14): 30.43, right at the oversold threshold after falling from ~50 on Nov 9 (50.8) in five sessions. It has made no new low yet, but momentum is clearly down. Oversold readings in a strong downtrend often stay oversold or give only brief bounces. [Bearish]
- 20 EMA: The 20 EMA isn't supplied, but EMA50 is $3.53 and price at $2.90 is about 18% below it. The EMAs are stacked bearishly (EMA50 $3.53 < EMA200 $4.45) and both are falling, so the area overhead acts as resistance. [Bearish]
- MACD: Line -0.108 is below Signal -0.093, so it has crossed back down after nearly crossing up on Nov 6-9. The histogram is slightly negative (about -0.015) and turning lower. Both lines are below zero, but the shallow readings show the momentum drop is recent. [Bearish]
- Bollinger Bands (20): Upper $3.51, lower $3.02. Price at $2.90 is below the lower band, which is a bearish expansion/breakdown close. The bands are narrow, so this is a fresh volatility breakout to the downside. A close back inside the band would be the first sign of a mean-reversion bounce. [Bearish]
- CMF (20): -0.205, well below the -0.05 threshold. It fell from roughly -0.04 on Nov 9 to -0.205, which shows sustained, accelerating distribution. [Distribution]
- ADX (14): 21.3 and rising from 17.0. −DI at 33.7 is far above +DI at 11.9, a wide gap showing the bears are in firm control. ADX is just crossing into trend-building territory while the downtrend extends. [Strong Trend Building – Bearish]
- Volume: 61.36M, the largest bars on the chart's right edge, with a red candle breaking to new lows. Heavy volume on a breakdown confirms selling pressure and suggests continuation rather than exhaustion, although climactic volume can precede a bounce. [Bearish – Breakdown Confirmation]
DIVERGENCES & TRENDS
- No bullish divergence yet: Price made a new low of $2.90 while RSI at 30.4 is still above its late-August/September trough (~25). This is not divergence, but it shows the selloff is less extreme than that earlier washout.
- Moving average structure: Price ($2.90) < EMA50 ($3.53) < SMA50D ($3.45) < EMA200 ($4.45) < SMA200D ($4.83) < VWAP ($4.93). Every average slopes down. The death cross (SMA50D below SMA200D) has been in place for months, and the EMA50/EMA200 bearish cross also persists.
- Price vs SMA200D: Price is about 40% below it, a deeply entrenched long-term downtrend.
- MACD: The bullish attempt (Nov 6-10, histogram improving) failed, and the MACD line rolled over below the signal line. That fits a failed bounce within the downtrend.
- DI/ADX: −DI jumped from 23 to 33.7 in three days as ADX rose from 17 to 21.3, so a trend is re-accelerating to the downside.
- CMF: It was positive in late October (briefly above +0.05) and has since collapsed, a sign that the bounce was sold into.
- Trend: The chart shows a series of lower highs since the ~$7 peak in April, with a steep drop in August to a $3.3–3.6 base. That base has now broken, with price slipping below $3.20 and then through $3.00.
CHART PATTERNS
- Bearish Rising Wedge / failed Bullish Falling Wedge: After the August drop, price formed a tight, slowly declining channel at $3.20–$3.60 (it resembles a falling wedge or flag). The Nov 12–13 break below the lower boundary ($3.15) invalidated any bullish reading and instead resembles a Bearish Flag/continuation pattern. The measured move of the August leg (from about $4.50 to $3.40, ~$1.10) applied to the break near $3.15 implies a target around $2.05–$2.30. That is an extreme projection, so I would haircut it for an 83-day window.
- Larger structure: The $7 → $2.90 decline is a persistent lower-high/lower-low sequence. The April peak was a rounded top with lower highs, a distribution-type structure.
- Key significance: Price is in open air with no visible support below $2.90 on the chart. Resistance is the broken range at $3.15–$3.30, then EMA50/SMA50D at about $3.45–$3.53.
POTENTIAL SCENARIOS
- Scenario 1: Bearish Trend Continuation — The flag/range breakdown extends, with -DI dominance, distribution on CMF, and heavy-volume breakdown candles. Price grinds lower with intermittent bounces that fail at the $3.10–$3.30 breakdown area. Trigger: daily closes below $2.85 with ADX above 25. Target: $2.45–$2.60, with an extreme low near $2.20. Invalidation: a daily close above $3.30 with MACD crossing back above signal. (55% probability)
- Scenario 2: Neutral Oversold Base / Relief Rally Fades — RSI oversold and price below the lower Bollinger Band trigger a mean-reversion bounce toward $3.10–$3.40, followed by consolidation around $2.70–$3.30. Trigger: close back inside the lower Bollinger Band with CMF stabilising above -0.10. Target: $3.20–$3.45 (EMA50/SMA50D). Invalidation: break below $2.70 on volume. (30% probability)
- Scenario 3: Bullish Reversal — Capitulation volume marks a bottom, and a news or earnings catalyst pushes price through the 50-day averages. Trigger: a close above $3.55 on rising volume with MACD turning positive. Target: $4.00–$4.40 (toward EMA200). Invalidation: failure at $3.50 and a close below $3.00. (15% probability)
PRICE TARGETS
- Target Price: $2.65 (83-day horizon, Feb 6, 2027)
- Expected Range: $2.15 to $3.35 (width $1.20, ≈41% of the $2.90 price, wider than the 18–30% guide for 61–180 days because the stock is at a volatile breakdown extreme with an ATR near 5% of price, but within what 83 days of volatility supports)
- Key Levels: Support at $2.60, Resistance at $3.25
Note on the self-check: the guidance for 61–180 days is about 18–30% (≈$0.52–$0.87), so the range above overshoots. To comply, I narrow it to $2.20 to $3.10 (width $0.90, ≈31%). Final Expected Range: $2.20 to $3.10.
- Final Target Price: $2.65
- Final Expected Range: $2.20 to $3.10
- Final Key Levels: Support at $2.60, Resistance at $3.25
OVERALL BIAS
OVERALL BIAS: BEARISH - Price has broken below its consolidation and the lower Bollinger Band on heavy volume, with every moving average sloping down in a death-cross structure. RSI is only at 30, CMF is -0.205, −DI (33.7) dominates +DI (11.9), and ADX is rising, all pointing to continued downside, while relief bounces should meet resistance at $3.25–$3.50.
This is educational analysis and not financial advice.